Pages

Showing posts with label ice. Show all posts

January 26, 2013

A "Goliath" Inconvenient Truth


Just this past August (2012), the chicken littles were out in full force warning us of imminent doom as the result of the melting Greenland ice sheets.
Today, Marco Tedesco, assistant professor of Earth and atmospheric sciences at The City College of New York, reported that melting over the Greenland ice sheet shattered the seasonal record in the modern era, a full four weeks before the close of the melting season. The melting season in Greenland usually lasts from June – when the first puddles of meltwater appear – to early September, when temperatures cool. This year, cumulative melting by 8 August had already exceeded the record of 2010 (chart above, year 2012 in red). "With more yet to come in August, this year's overall melting will fall way above the old records.
Wanting to be sure we understood how big a deal this is, they even broke into the biblical references
That's a goliath year
A Goliath year, wow that is big. How "Goliath" was it?
-- the greatest melt since satellite recording began in 1979," said Professor Tedesco.
Since 1979! Since 1979? I mean we are talking about dramatic changes not recorded since the end of the Disco epoch!

BUT, a new study puts the absurdity of this alarmist claim in perspective. As the Houston Chronicle...chronicles  (emphasis mine)
The study used ice cores to study conditions during a period of natural global warming that occurred between 115,000 and 130,000 years ago, when temperatures were about 14.5 Fahrenheit degrees higher than they are today. This was known as the Eemian period.
So what happened to the Greenland ice sheet when temperatures were 14.5 degrees warmer than today? During a period of natural global warming?
During this inter-glacial time about 75 percent of Greenland’s ice sheet remained intact.
Nowhere in any literature that I have ever read are any of the alarmist scientist predicting that temperatures as the result of man made CO2, going to come close to a 14.5 degree Fahrenheit increase.

In fact since the end of the Disco epoch (1979) the illustrious IPCC says that global temperatures have increased .72 degrees Fahrenheit or less than 5% of the increase experienced in the Eemian period. The absolute worst case scenarios projected by the IPCC for temperature increases as the result of a doubling of CO2 is 11.4 degrees Fahrenheit a full three degrees lower than previously experienced according to this study.

In the abstract to the new study we are told: (emphasis mine)
The response of the Greenland ice sheet to the warmer-than-present climate of the Eemian has thus remained unclear. Here we present the new North Greenland Eemian Ice Drilling (‘NEEM’) ice core and show only a modest ice-sheet response to the strong warming in the early Eemian.
Or as the Chronicle writer observed in the opening to his article:
New research suggests that Greenland’s vast ice sheet isn’t as fragile as some climate scientists feared.

The work, published in Nature this week (see abstract), indicates the majority of ice on Greenland could remain intact for hundreds of years even if the planet warms considerably.
Why is this important? It is important because the fear of the Greenland ice sheet melting is among the sited as one of the largest contributors to sea level rise that the alarmist use to scare the populace and drive public policy.

This narrative is embedded into our culture and has been taught in our schools for a generation, and continues to be.

What will happen in the future?

If people keep adding greenhouse gases to the atmosphere, the average sea level around the world by the end of this century (the year 2099) could be anywhere from 7 to 23 inches higher than it was in 1990. Sea level could rise even more if the big ice sheets in Greenland and Antarctica melt faster.

But the big ice sheets in Greenland will not melt faster, nor will the one in Antarctica, which is for another day.

The truth is that scientist have now shown that even if temperatures were to increase beyond the alarmist wildest claims, my home here near the Florida coast will be bulldozed under by future developers long before it is covered over by the rising Atlantic as depicted in Al Gore's fairy tale movie.

Yet people still believe in the fairy tale and that is a "Goliath" of an Inconvenient Truth.

January 20, 2013

"Very rarely" ain't never


I should be used to it, but I still am flabbergasted when reporting on the scientific community creates an alarming narrative out of something that they, in some study, show has happened before and thus is not only not unprecedented but in all likelihood is a natural recurring event.

 It would seem to me, though what do I know, that if you show that something that is occurring in nature today has occurred in the past your first supposition should be that what caused it in the past is causing it again. If, after all, you can not explain the previous occurrence what basis do you have in attributing the current event to some new cause?

Yet the scientific community consistently is so lacking in intellectual curiosity and so focused on maintaining their death grip hold on their cash cow of "climate change"  that they will immediately attribute or leave the impression that current natural recurring events are the result of man made climate change. They often do this without attempting to explain or understand the previous occurrences which could not possibly be attributable to man's influence.  

A recent example of this comes from a new study undertaken to look for
... new clues about the recent rapid ice loss from the West Antarctic Ice Sheet and help scientists make better predictions about future sea-level rise.
First off let me just ask, how can you have a better basis for for predicting the future when you have no explanation for the past? At the bottom of the article we are told that this rather expensive research was needed in order to
... improve the accuracy of computer models that are essential to predict future ice loss in the Amundsen Sea sector of the West Antarctic Ice Sheet and its likely contribution to global sea-level rise. 
This is all well and good but the fact of the matter is that in order to determine future ice loss don't you need to understand why you are losing ice in the first place? (emphasis mine)
Reporting this month in the journal Geology a team of researchers from British Antarctic Survey (BAS), the Alfred Wegener Institute for Polar and Marine Research (AWI) and the University of Tromsø presents a timeline for ice loss and glacier retreat in the Amundsen Sea region of West Antarctica. The team concludes that the rapid changes observed by satellites over the last 20 years at Pine Island and Thwaites glaciers may well be exceptional and are unlikely to have happened more than three or four times in the last 10,000 years.
At the risk of sounding naive, how could something that has ."happened more than three or four times in the last 10,000 years." be refereed to in the same sentence  as " exceptional"? I would think that, in a geological time frame, something that has occurred three or four times in 10,000 years is not all that exceptional and obviously is not unprecedented.

 After a somewhat confusing description by the lead author of the study of what the team is investigating and why:
"As snow and ice builds up on the vast Antarctic Ice Sheet, the ice flows from the centre of the continent through glaciers towards the sea where it often forms floating ice shelves and eventually breaks off as icebergs. The floating ice shelves hold back the ice on land. A critical issue for us is to understand how the 'grounding line' – the position where the ice sitting on land (glaciers) begins to float (ice shelves) – has retreated landward over time. Satellite data are available only for the last 20 years and show that since 1992 the Pine Island and Thwaites glaciers have experienced significant thinning (melting), flow acceleration and rapid landward retreat of their grounding lines, with that of Pine Island Glacier having retreated up to 25 km. It's possible that the grounding lines may retreat even further inland over coming decades....
We are again informed that this is not a unique event:
" ...Our study has revealed that episodes of fast glacier retreat similar to that observed over recent decades can only have occurred very rarely during the previous 10,000 years."
The first question it seems to me that a scientist interested in truly investigating this or a journalist reporting on this would ask is "what caused the previous instances of rapid retreat?"  But the question is not addressed in the article and so far as I have been able to discover, nowhere do the scientist attempt to explain previous occurrences.

In fact the authors admit that they really do not have a clue:
. However, it is unknown if the contemporary dynamic changes are simply part of long-term WAIS retreat since the Last Glacial Maximum (LGM, ca. 23,000–19,000 cal. yr B.P.), or solely recent phenomena.
Putting aside that these scientist are investigating a phenomena which they have labeled exceptional based on "only... 20 years of satellite data" they can not even determine if these changes are unique or natural but wish to use their findings to "improve the accuracy of computer models that are essential to predict future ice loss... and its likely contribution to global sea-level rise."   

Well how exactly do you do that? How do you use a phenomena that you can not explain to predict future ice loss?

When the skeptic community makes the charge that climate models are based on nothing more than suppositions not grounded in scientific reality they are accused of somehow being unscientific deniers. Yet here we have just such an example of how the scientific community creates suppositions to program their climate models and thus feed the climate change academic complexes coffers for future tax payer funded research.

"Very rarely"ain't never and to use current geological and climatic events which, by their own admission, are neither unprecedented or often times even all that unique as a basis to fund research is nothing less than fraud. The fact that they can not even explain the previous events but simply label current similar events as being caused by man made influences is not only unscientific, it is immoral.

Though  immorality in the scientific community is neither unprecedented or unique.


March 26, 2011

Missing from the models

Here is yet another piece of that ever expanding puzzle which is the Earth's ecosystem which has not been included in the climate models. I don't know if anyone has kept track of all the components in nature that have not been included in the modern climate models upon which so many policy decisions are being made, but someone ought to.

One would think that the modelers themselves would do so and adjust their models to allow for new scientific discoveries. I do not know that they do not do this but it would seem that if they did we should see press releases from the appropriate institutions explaining how new evidence has altered previous output. They seem more than willing to tweak their models in order to explain why previously unexplained events are taking place, but I never hear that when a new negative feedback is discovered that the models have been adjusted to compensate. Based upon my observation of the science behind climate science it seems as if they only recognize those findings that confirm their theory not those that would in anyway diminish the theory.

FROM-KOLD 13

Icebergs may increase ocean carbon uptake


The following is a news release from the National Science Foundation.

In a finding that has global implications for climate research, scientists have discovered that when icebergs cool and dilute the seas through which they pass for days, they also raise chlorophyll levels in the water that may in turn increase carbon dioxide absorption in the Southern Ocean.

An interdisciplinary research team supported by the National Science Foundation (NSF) highlighted the research this month in the journal Nature Geosciences.

The research indicates that "iceberg transport and melting have a role in the distribution of phytoplankton in the Weddell Sea," which was previously unsuspected, said John J. Helly, director of the Laboratory for Environmental and Earth Sciences with the San Diego Supercomputer Center at the University of California, San Diego and Scripps Institution of Oceanography.

Helly was the lead author of the paper, "Cooling, Dilution and Mixing of Ocean Water by Free-drifting Icebergs in the Weddell Sea," which was first published in the journal Deep-Sea Research Part II.

The results indicate that icebergs are especially likely to influence phytoplankton dynamics in an area known as "Iceberg Alley," east of the Antarctic Peninsula, the portion of the continent that extends northwards toward Chile.

The latest findings add a new dimension to previous research by the same team that altered the perception of icebergs as large, familiar, but passive, elements of the Antarctic seascape. The team previously showed that icebergs act, in effect, as ocean "oases" of nutrients for aquatic life and sea birds.

The teams's research indicates that ordinary icebergs are likely to become more prevalent in the Southern Ocean, particularly as the Antarctic Peninsula continues a well-documented warming trend and ice shelves disintegrate. Research also shows that these ordinary icebergs are important features of not only marine ecosystems, but even of global carbon cycling.

"These new findings amplify the team's previous discoveries about icebergs and confirm that icebergs contribute yet another, previously unsuspected, dimension of physical and biological complexity to polar ecosystems," said Roberta L. Marinelli, director of the NSF's Antarctic Organisms and Ecosystems Program.

NSF manages the U.S. Antarctic Program, through which it coordinates all U.S. scientific research and related logistics on the southernmost continent and aboard ships in the Southern Ocean.

The latest findings document a persistent change in physical and biological characteristics of surface waters after the transit of an iceberg, which has important effects on phytoplankton populations, clearly demonstrating "that icebergs influence oceanic surface waters and mixing to greater extents than previously realized," said Ronald S. Kaufmann, associate professor of marine science and environmental studies at the University of San Diego and one of the authors of the paper.

The researchers studied the effects by sampling the area around a large iceberg more than 32 kilometers (20 miles) long; the same area was surveyed again ten days later, after the iceberg had drifted away.

After ten days, the scientists observed increased concentrations of chlorophyll a and reduced concentrations of carbon dioxide, as compared to nearby areas without icebergs. These results are consistent with the growth of phytoplankton and the removal of carbon dioxide from the ocean.

The new results demonstrate that icebergs provide a connection between the geophysical and biological domains that directly affects the carbon cycle in the Southern Ocean, Marinelli added.

In 2007, the same team published findings in the journal Science that icebergs serve as "hotspots" for ocean life with thriving communities of seabirds above and a web of phytoplankton, krill and fish below. At that time, the researchers reported that icebergs hold trapped terrestrial material, which they release far out at sea as they melt, a process that produces a "halo effect" with significantly increased nutrients and krill out to a radius of more than three kilometers (two miles).

The new research was conducted as part of a multi-disciplinary project that also involved scientists from the Monterey Bay Aquarium Research Institute, University of South Carolina, University of Nevada, Reno, University of South Carolina, Brigham Young University, and the Bigelow Laboratory for Ocean Sciences.

Scripps Institution of Oceanography research biologist Maria Vernet and graduate student Gordon Stephenson also contributed to the paper.

Note how little emphasis is put on the fact that this will alter previous assumptions on the global climate cycle which is no small matter....one would think.

"If a model has not been proven to fully reflect reality, then it has very limited use and should be treated with the same degree of consideration that one might give a horoscope "

 John Droz, Jr.

January 23, 2010

Dead batteries melt ice


In my morning reading I come across two articles which as often happens in the realm of the AGW literature, seem to be at odds with each other.

One is a story from the UK Telegraph "Pen Hadow admits battery was the problem on Arctic climate change expedition" A story of the problems encountered during this intrepid explorer's adventures this past year for the insurance industry and Prince Charles. The travails of "explorer" Hadow and his battery problems are not what interest me but this often repeated claim which we hear ad nausea in the media.


But he insisted the trek was still a success as the team managed to take
hundreds of measurements of the sea ice using a traditional drill. The average
thickness of ice floes was 1.77 metres, suggesting the ice sheet is now largely
made up of first year ice rather than "multiyear" ice that will have built up
over time. Cambrige University scientists who analysed the data said it proved global warming is happening faster than ever and the Arctic could be largely ice free within a decade.


Putting side the absolute farce of the expedition and their "readings" one wonders how the highlighted sentence can be true if the second article is also true.


From Watts Up With That? this morning we read "Arctic temperatures above 80°N are the lowest in six years"

According to the Danish Meteorological Institute, Arctic temperatures are
currently below 238K (-35.15 degrees Celsius or -31.27 degrees
Fahrenheit)
That is more than five degrees below normal (the green line) and
the lowest reading since 2004. The slope of decline has also recently been quite
sharp, dropping from 252K on January 1, a drop of 14 degrees in 22 days

And they provide us with these nifty charts to show us the recent trends:


and a slightly longer view:


Now call me skeptical-please, but what in the recent temperature record would cause any legitimate scientist to conclude that
"global warming is happening faster than ever and the Arctic could be largely ice free within a decade."

It has always been my understanding that when it gets colder the likelihood is that more ice will form rather than melt but then again I don't have dead batteries to investigate the phenomena.

More...


January 5, 2010

"The Other Side Of The Story"


This Episode brought to you by WORLD CLIMATE REPORT


Lessons of the Ice


We have all heard over and over that the icecaps are melting, glaciers are retreating, and sea level is rising as ice around the world turns to liquid water. We have covered this topic many times in our essay series, but we revisit the ice issue given two recent and important publications in the science literature.


The first article of interest is in the prestigious Journal of Climate written by two atmospheric and earth scientists from Canada. The title of the article is “A five-year record of summer melt on Eurasian Arctic ice caps”, and we never thought we would have much interest in the piece given its five-year time frame. We were wrong.

Sharp and Wang were concerned with summer melt for the Arctic sub-regions shown in the map below, and they used satellite-based “scatterometer” data to assess the rates of melt in the study area. It is a complicated story, but basically, when liquid water is present in near-surface layers of snow and firn (compact snow), there is a sharp reduction in microwave backscatter received by the satellite. More basic, but similar, measurement techniques have been used since 1973 to estimate melt activity from satellites, and the methods appear to work with reasonable accuracy. For most of the Sharp and Wang article, maps and tables are presented for their five-year 2000-2004 study period, and the results are impressive.


Figure 1. Map of the Arctic showing the locations of Svalbard (A), Novaya Zemlya (B), Severnaya Zemlya (C), the Queen Elizabeth Islands (D), and Greenland (E) relative to the major Arctic Ocean current systems (from Sharp and Wang, 2009).

A section in the article entitled “Longer-term context” is where the action is for us! Sharp and Wang determined the relationship between 850 mb temperatures (atmospheric temperatures about 5,000 feet above sea level) and annual and June-August melt season duration. The results were excellent for the June – August period with correlation coefficients between temperature and snow melt duration ranging from 0.91 to 0.95 for various sub-regions shown on the map. Next, they used the known 850 mb temperatures from 1948-2005 to estimate melt duration in over the past six decades. To our surprise, they conclude “If we consider all discrete 5-yr periods (pentads) between 1950 and 2004, the 2000–04 pentad has the second longest mean predicted melt duration on Novaya Zemlya (after 1950–54), and the third longest on Svalbard (after 1950–54 and 1970–74) and Severnaya Zemlya (after 1950–54 and 1955–59).”

We cannot help but notice that the time of greatest melting was the pentad from 1950 to 1954. Is that curious or what? The Earth warmed from 1910 to the mid-1940s, cooled from mid-1940s to the mid-1970s, warmed from the mid-1970s to the late 1990s, and has not warmed or cooled over the most recent decade. The 1950 to 1954 pentad with the longest melt seasons happens to have occurred during a time of global cooling. The same can be said for the 1955-1959 and 1970-1974 pentads with long melt seasons. The 2000-2004 pentad has seen relatively large melt duration periods, but to suggest that it was caused by global warming is not consistent with the largest melt duration values occurring during a time of global cooling.

Next up, Indian geologist Ravinder Kumar Chaujar of the Wadia Institute of Himalayan Geology published a recent paper in Current Science of interest to us at World Climate Report. Chaujar investigated the retreats and advances of the Chorabari glacier located near the long-standing Kedarnath Temple in the Himalayan region. The author notes that “Two wall engravings of writings/poems dated AD 650 and 850, on the back boundary wall of the temple, discuss the beauty of the Kedarnath temple. There is no mention about snow/ice/glaciers in them. These findings suggest that there was no glacier during that period around the temple.” These dates precede the Medieval Warm Period and remind us that modern day glaciers in the region have certainly come and gone many times in the past, long before anyone could blame humans for glacial retreats.

But the warmth ended, and as stated by Chaujar, “We consider that glaciations in the region started during the mid-14th century, i.e. the beginning of the Little Ice Age”. The Chorabari glacier advanced at this time, and it appears to have gone through periods of advances and retreats. As the glacier would advance, it would bulldoze rocks at its terminus, and there would be no chance of lichens establishing themselves in the active rock zone. However, once the glacier would retreat, the rocks would be left behind, and lichens could then be established. A variety of lichenometric techniques are available to date when the lichens began to grow, and those dates would indicate when the glacier began to retreat. Chaujar determined that the retreat began 258 years ago; around 1748 AD warming at regional and possibly global scales caused the melting. However, we read “After the peak of the Little Ice Age, recession of the glacier was followed by its three major stages of advance and retreat as indicated by the four loops of terminal and lateral moraines of the glacier.”

Two major lessons come from this study. One, any argument that the Medieval Warm Period and Little Ice Age were confined to Europe is clearly not supported by the evidence from the Himalayan region. Two, glaciers have advanced and retreated many times in the past with absolutely no connection to humans and/or the atmospheric concentration of greenhouse gases. To suddenly pronounce that glaciers are responding to human activities seems to disregard their behavior during periods when human activities certainly had no impact whatsoever.

Glaciers around the world are generally experiencing a melt period at present and there is evidence of melting occurring in the Arctic. However, as seen in the Chaujar and Sharp and Wang articles, there is a lot more to the story when it comes to linking global warming to melting ice.

References:

Chaujar, R.K. 2009. Climate change and its impact on the Himalayan glaciers – a case study on the Chorabari glacier, Garhwal Himalaya, India. Current Science, 96, 703-708.

Sharp, M., and L. Wang. 2009. A five-year record of summer melt on Eurasian Arctic ice caps. Journal of Climate, 22, 133-145.


More...


October 7, 2009

"Sure is quiet out there"


FROM-World Climate Report


Antarctic Ice Melt at Lowest Levels in Satellite Era

Where are the headlines? Where are the press releases? Where is all the attention?

The ice melt across during the Antarctic summer (October-January) of 2008-2009 was the lowest ever recorded in the satellite history.

Such was the finding reported last week by Marco Tedesco and Andrew Monaghan in the journal Geophysical Research Letters:

A 30-year minimum Antarctic snowmelt record occurred during austral summer 2008–2009 according to spaceborne microwave observations for 1980–2009. Strong positive phases of both the El-Niño Southern Oscillation (ENSO) and the Southern Hemisphere Annular Mode (SAM) were recorded during the months leading up to and including the 2008–2009 melt season.


Figure 1. Standardized values of the Antarctic snow melt index (October-January) from 1980-2009 (adapted from Tedesco and Monaghan, 2009).

The silence surrounding this publication was deafening.


It would seem that with oft-stoked fears of a disastrous sea level rise coming this century any news that perhaps some signs may not be pointing to its imminent arrival would be greeted by a huge sigh of relief from all inhabitants of earth (not only the low-lying ones, but also the high-living ones, respectively under threat from rising seas or rising energy costs).

But not a peep.

But such is not always the case—or rather, such is not ever the case when ice melt is pushing the other end of the record scale.

For instance, below is a collection of NASA stories highlighting record high amounts of melting (or in most cases, simply higher than normal amounts in some regions) across Greenland in each of the past 3 years, as ascertained by Marco Tedesco (the lead author of the latest report on Antarctica):

NASA Researcher Finds Days of Snow Melting on the Rise in Greenland

“In 2006, Greenland experienced more days of melting snow and at higher altitudes than average over the past 18 years, according to a new NASA-funded project using satellite observations….”

NASA Finds Greenland Snow Melting Hit Record High in High Places

“A new NASA-supported study reports that 2007 marked an overall rise in the melting trend over the entire Greenland ice sheet and, remarkably, melting in high-altitude areas was greater than ever at 150 percent more than average. In fact, the amount of snow that has melted this year over Greenland is the equivalent of more than twice the surface size of the U.S…”

Melting on the Greenland Ice Cap, 2008

“The northern fringes of Greenland’s ice sheet experienced extreme melting in 2008, according to NASA scientist Marco Tedesco and his colleagues.”

And lest you think that perhaps NASA hasn’t had any data on ice melt across Antarctica in past years, we give you this one:

NASA Researchers Find Snowmelt in Antarctica Creeping Inland

“On the world’s coldest continent of Antarctica, the landscape is so vast and varied that only satellites can fully capture the extent of changes in the snow melting across its valleys, mountains, glaciers and ice shelves. In a new NASA study, researchers [including Marco Tedesco] using 20 years of data from space-based sensors have confirmed that Antarctic snow is melting farther inland from the coast over time, melting at higher altitudes than ever and increasingly melting on Antarctica’s largest ice shelf.”


But this time around, nothing, nada, zippo from NASA when their ice melt go-to guy Marco Tedesco reports that Antarctica has set a record for the lack of surface ice melt (even more interestingly coming on the heels of a near-record low ice-melt year last summer).

So, seriously, NASA, what gives? If ice melt is an important enough topic to warrant annual updates of the goings-on across Greenland, it is not important enough to elucidate the history and recent behavior across Antarctica?

(These are not meant as rhetorical questions)

Reference

Tedesco M., and A. J. Monaghan, 2009. An updated Antarctic melt record through 2009 and its linkages to high-latitude and tropical climate variability. Geophysical Research Letters, 36, L18502, doi:10.1029/2009GL039186.

More...


September 5, 2009

B.O.B. Presents


Best Of the Blogs


Roger Pielke Jr.'s Blog:Climate Forecast "Out Of Kilter"


Arctic ice proves to be slippery stuff


The extent of the sea-ice is now half a million square kilometres more than it was this time last year, says Christopher Booker.
FROM-UK Telegraph

BBC viewers were treated last week to the bizarre spectacle of Mr Ban
Ki-moon standing on an Arctic ice-floe making a series of statements so laughable that it was hard to believe such a man can be Secretary-General of the UN. Thanks to global warming, he claimed, "100 billion tons" of polar ice are melting each year, so that within 30 years the Arctic could be "ice-free". This was supported by a WWF claim that the ice is melting so fast that, by 2100, sea-levels could rise by 1.2 metres (four feet), which would lead to "floods affecting a quarter of the world".

Everything about this oft-repeated item was propaganda of the silliest kind. Standing 700 miles from the Pole, as near as the stubbornly present ice would allow his ship to go, Mr Ban seemed unaware that, although some 10 million square kilometres (3.8 million square miles) of sea-ice melts each summer, each September the Arctic starts to freeze again. And the extent of the ice now is 500,000 sq km (190,000 sq m) greater than it was this time last year – which was, in turn, 500,000 sq km more than in September 2007, the lowest point recently recorded (see the Cryosphere Today website). By April, after months of darkness, it will be back up to 14 million sq km (5.4 million sq m) or more.

Mr Ban seems equally unaware that, even if all that sea-ice were to melt, this would no more raise sea-levels than a cube of ice melting in a gin and tonic increases the volume of liquid in the glass. If he is relying for his "100 billion tons" on land ice melting in Antarctica and Greenland, he should note that much of their ice sheets are growing rather than shrinking. His "100 billion tons" is fantasy.

Similarly worthy of the Booker Prize for fiction was WWF's claim that sea levels might rise by four feet (twice the most extreme guess by those UN computer models), let alone the ludicrous claim that this would flood "a quarter of the world". But Mr Ban was indulging in this childish publicity stunt for the same reason the BBC, the Royal Society and others have lately been banging on about various mad schemes for "climate engineering", such as putting up vast mirrors in space to keep out the sun's rays or lining our motorways with artificial trees to suck deadly CO2 out of the air, to be taken away and buried in holes in the ground.

Why are they all going off their heads like this, in emulation of the "projector" that Gulliver met on his travels, in the Academy of Lagado, who had designed a scheme for extracting sunbeams from cucumbers? It is because they are desperately trying to whip up alarm over global warming before December's planned "climate treaty" in Copenhagen, when all evidence suggests that they are not going to get the successor to the Kyoto Protocol they want.

The countries of the developing world, led by China, India, Russia and Brazil, continue to insist that, since global warming is all the fault of the already developed countries of the West, it is up to the West to cut its CO2 emissions by 80 per cent, while the rest of the world is allowed to catch up. Some, such as China, are prepared to make token emission cuts, but only so long as they are compensated by the West to the tune of trillions of pounds a year. As some of the gloomier warmists admit, Copenhagen looks to be a dead duck.

According to Government figures, however, we in Britain are already committed to spending, under the Climate Change Act, £18 billion every year between now and 2050 on this nonsense – daft light bulbs (see below), electricity blackouts and all. In other words, we are only beginning to see some of the nastier consequences of this crazy make-believe, based on nothing more substantial than the kind of gibberish we got last week from Mr "Light Bulb" Ban and the BBC.


More...


August 31, 2009

Skating on the Hudson ?


FROM- New Haven County Environmental Policy Examiner-Kirtland Griffin

Will the quiet Sun leave us with summer sea ice as far south as NYC by 2120?

During the past two summers a strange thing has happened in the Arctic that is made even stranger by the alleged global warming that is occurring. The point often missed in the media and political discourse is that the extent of sea ice at the summer minima in the Arctic is growing. There has been more ice than the year before by approximately 400,000 square kilometers per year for the past 2 years. Now we know that this is likely not a linear phenomenon but often the climate is projected to follow linear progressions to illustrate the possible man-made global warming alarmist outcomes that could occur. Now, this may be a simplistic approach, but it is interesting to note how that could be turned around to illustrate the point.

At the present time, according to http://www.cryospheretoday.com/ the current sea ice extent is approximately 3.6 million square kilometers. This is approximately 0.4 million square kilometers more than 2008 at this time last year and the same larger than the 2007 minimum. Thus we have a 0.4 square kilometer per year growth rate. The area of the Earth north of the latitude of New York City is approximately 47.5 million square kilometers. Subtracting the current ice area, 3.6 million square kilometers, the net difference comes to 43.9 million square kilometers. This represents the area of ice that would have to grow to have a frozen Hudson River in New York City. Dividing by the rate of increase of the Arctic Ice Cap of 0.4million square kilometers per annum we get a figure of 110 years plus or minus. So under these assumptions, Summer Sea Ice extent could engulf New York by 2120. That would likely mean that winter ice could extend further South but the data are not clear on that outcome. The formula for determining the surface area was 2piR^2(1-Cos A) for an included angle of 120 degrees. This is actually a conservative estimate since there is substantial land within this area that would not have to freeze. Also, once the ice reached a certain point, the ice rate of increase would likely increase dramatically. We could call this a tipping point beyond which reversal would be impossible. Sound familiar? This could shorten the time by as much as 50 years.

Figuring this backwards for a decreasing sea ice, using the same practice, an ice-free Arctic could occur within 20 years or so. I have seen projections of 25 to 30 years for this to happen and I suspect the logic is similar to mine.

So is skating across the Atlantic in 110 years out of the question? I think so. But then so is an ice-free Arctic.
More...


August 15, 2009

Science On Thin Ice


FROM-AIR VENT

Antarctic Land Ice Thinning?


I considered complaining about Dhog’s idiocy at RC but ran into an improbable news story. This is an unusual post for the summer. Rather than the Arctic ice doom stories, we’re hearing about Antarctic ice doom and what’s more, it isn’t attributed to global warming, although they want it to be. Well doom is doom so we should find out what Hollywood is going to base next years movies on.


Antarctic
Glacier Thinning At Alarming Rate

ScienceDaily (Aug. 15, 2009) — The thinning of a gigantic glacier in Antarctica is accelerating, scientists report. The Pine Island Glacier in West Antarctica, which is around twice the size of Scotland, is losing ice four times as fast as it was a decade years ago.


Twice the size of Scotland is loosing ice four times as fast as a decade ago!! Wow. All that and the temperatures haven’t warmed......
read entire article here
More...


August 9, 2009

"To our surprise.."


FROM-The Hindu
'Weather variations, not global warming cause glacier melt'


New Delhi (PTI): Himalayan glaciers, including the world's highest battlefield Siachen, are melting due to variations in weather and not because of global warming, Jammu University scientists have claimed.

"The field studies from other glaciers in India also corroborate the fact that inter and intra-annual variations in weather parameters have more impact on the glaciers of northwest Himalayas, rather than any impact due to global warming," they said.

Geologists R K Ganjoo and M N Koul of Jammu University's Regional Centre for Field Operations and Research of Himalayan Glaciology visited the Siachen glacier to record changes in its snout last summer.

"To our surprise, the Siachen glacier valley does not preserve evidences of glaciation older than mid-Holocene, suggesting that the glacier must have advanced and retreated simultaneously several times in the geological past, resulting in complete obliteration and modification of older evidences," they said reporting their findings in 'Current Science'.

Ganjoo and Koul dubbed as "hype" some earlier studies which suggested that the Himalayan glaciers were melting fast and caused serious damage to the Himalayan ecosystem.

There is sufficient field and meteorological evidence from the other side of Karakoram mountains that corroborate the fact that glaciers in this part of the world are not affected by global warming, they said.

"Overwhelming field geomorphological evidences suggest poor response of the Siachen glacier to global warming. The snout of the Siachen glacier of 2008 has retreated by about 8-10 metres since 1995, making an average retreat of 0.6 metre per year," the scientists said.

Ganjoo said that the east part of the Siachen glacier showed faster withdrawal of the snout that is essentially due to ice-calving, a phenomenon that holds true for almost all major glaciers in the Himalayas and occurs irrespective of global warming.

The west part of the Siachen has reduced due to the action of melting water released from the retreated tributary glacier, he said.

Ganjoo contended the Siachen glacier shows hardly any retreat in its middle part and thus defies the "hype" of rapid melting.

More...


July 28, 2009

Exporting fudged ice


Below are excerpts from an article in the Toronto Star - "Arctic's 'canary in a coal mine' " I thought it was fascinating for both the honesty of the scientist quoted and the absolute lack of any scientific proof of "climate change".

The first excerpt is about one of the main purpose of this well funded mission is intended to investigate, plankton:


"If a Pacific species was established in the Arctic, this would really be news," he says. "But we have not detected this yet. What could happen in this scenario is that, if the invader out-competes the native species, this could lead to fundamental changes in ecosystem function

As you can see we are not yet in any danger of this canary. But don't worry there is reason to panic as the writer makes sure to tell us:

As concern builds over rising temperatures, the once ice-bound Northwest Passage is opening up to scientists eager to get a better look at what is happening to a region thought to be most vulnerable to early damage from climate change.

Despite the fact that what they are investigating isn't a problem "concern builds", if not the plankton. Perhaps the next scientist will explain why we should be concerned:


When the Soviet Union collapsed, and relations between Washington and Moscow warmed, the U.S. military was less worried about potential enemies knowing where its subs had been and declassified the ice data. It seemed to show the ice was thinning dramatically.

Seemed to show? Please do explain.

"Nobody really quite noticed the submarines were running across the outside edges of the Canadian archipelago," the islands scattered across Canada's Far North, "where for all we know, the ice was getting thicker," Eert says.

"The ice doesn't stay constantly thick over the whole area. It moves around. So if you take measurements only in one spot, and make global conclusions from that, you might be going wrong."

Well jeez making global conclusions from incomplete data doesn't seem like a smart idea to me either, might want to tell some of your colleagues about that- but it gets better:


After years of reports that vast areas of Arctic ice are melting as the seawater below, and air above, warm up, scientists have discovered that dramatic changes in the past three years are the result of shifting winds, perhaps caused by climate change .


Enormous amounts of ice have "been exported from the Arctic," driven by winds that are shifting as the climate changes, which pushed the ice into ocean currents that delivered it to the North Atlantic, Eert says.

"The multi-year ice in the polar pack didn't melt in the Arctic Ocean,'' she says. "It moved out and what's left in the Arctic is thinner than it was."

That doesn't mean some Arctic ice isn't disappearing altogether, just that the process is not as simple as some reports suggest, Eert says.

Old ice that has shifted south from Greenland may have a counter-effect on the climate, which is just one of the many pieces of a very complex jigsaw puzzle that scientists are trying to piece together as they attempt to predict the effects of global warming.

"The guys who are running the long-term climate models have a tough problem," Eert says. "They're looking at really long time scales, and as result they can't look at a lot of details for each year.

"In order to get the results before you die, you have to fudge some things. And what they fudge is the small-scale stuff. But it turns out that probably the small-scale stuff is important and fudging it gives you wrong answers."


So what have we learned. The plankton that would be a harbinger of disaster is not present, the data from submarines was misinterpeted,the thin ice is the result of shifting winds not melting, and the modellers are fudging in order to get the results they want before they die. Got to love this scientific proof! Not to mention the canary.

So in the end what is the conclusion of this article:


The latest maps show above-normal concentrations of ice across a huge region in western Hudson Bay and James Bay, while some areas farther north have less ice than usual. Deciding what that all means is above Pelland's pay grade


But not above ALGORE'S pay grade he'll tell you what it means "WE'RE GOING TO FRY, if we don't drown first"
More...


June 27, 2009

Chill the Vikings won't be returning soon


FROM-The Migrant Mind

Greenland:Degree Days and the Lack of Warming

Greenland is melting, at least that is the headlines. Everyone in the global warming camp is quaking in their boots awaiting the great flood, foretold long ago by Algore the Magnificent.

Tonight we are going to look at the data for Greenland. There are only a few stations on Greenland which have any length at all. The longest is for Godthab Nuuk 64.17N 51.75W degrees. That record begins in 1866.

Now, if Greenland's temperature is warming, we should see it easily in the degree days above zero. Ice, of course can't melt if it is below zero. It can ablate, but ablation is not caused by global warming. So, if Greenland is warming we should see an increase in both the temperature and the number of days spent above zero deg C. The multiplication of temperature and days is called degree-days. Such calculations are used by electrical companies to estimate how much electricity will be needed for a given area. We can use it to see if there is an increase in degree-days over the past century in Greenland. Below is the degree-days for Godthab Nuuk, Greenland.....
read rest of article here

More...


June 19, 2009

"Ignorance of the NASA writers is on display"


FROM- The Migrant Mind

(excerpt from)

Being Colder Makes the Ice Melt


....NASA says there is no evidence for warming in the southern hemisphere. This is horse-hockey, ladies and gentlemen. Ignorance of the NASA writers is on display, but then, they do want to scare you into giving them your hard earned money in the form of taxes.


The interesting thing is that they are depending on models to tell them what the night time temperature is. All one can get from paleoclimatic information on the ground is indicators of average temperature. And all the indicators I have seen say the mean temperature was warmer by the 2-3 deg C seen in the map on the above referenced page. Those numbers are mean increases in temperature.

Let's look at the logic in the above statement that there is no evidence that Antarctica was warmer during the Climatic Optimum than today. It is sadly clear to me that people don't remember what they read on this blog from a few weeks back, nor do they look up data before responding to what is written.

If you do nothing else with this post read the bolded parts of the quotations below

From my post on March 23, 2009 here

The stability of floating ice shelves is an important indicator of ocean circulation and ice-shelf mass balance. A sub–ice-shelf sediment core collected during the Austral summer of 2000–2001 from site AM02 (69842.89S, 72838.49E) on the Amery Ice Shelf, East Antarctica, contains a full and continuous record of glacial retreat. The AM02 core site is ;80 km south of the floating ice shelf edge and contains a 0.5-m-thick Holocene surface layer of siliceous mud and diatom ooze of marine origin. Core data are supportive of sub– ice-shelf circulation models that predict the landward flow of oceanic water, and prove that the landward transport of hemipelagic sediments occurs beneath floating ice shelves over distances of at least ~80 km. An increase in sea-ice–associated diatom deposition in the upper part of the Holocene suggests that a major retreat of the Amery Ice Shelf to at least 80 km landward of its present location may have occurred during the mid-Holocene climatic optimum." Mark A. Hemer and Peter T. Harris, " Sediment core from beneath the Amery Ice Shelf, East Antarctica,"Geology; February 2003; v. 31; no. 2; p. 127–130, p. 127

How in the hell can NASA say that there is no evidence of the southern hemisphere being warmer when the Amery Ice Shelf was melted by 80 km during that period?

A question for NASA, if it was colder then than now, was it the cold that melted this ice cap? Utter illogic. The guy who wrote the NASA website ignored this evidence or didn't do sufficient research to know of it.

More...


June 4, 2009

A little arctic history says goodbye


Rest in peace to an American hero. By the way February is winter at the North Pole isn't it? Please read the entire article as he truly did live an amazing American life.


(excerpt from)
Vice Adm. James F. Calvert dies at 88


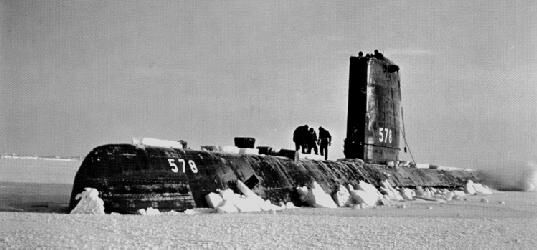
Calvert was the commanding officer of the nuclear-powered USS Skate from December 1957 to September 1959. The submarine became the first to surface at the North Pole in February 1959. Calvert wrote about the experience in a book titled "Surface At The Pole." The trip had been made to test how well a submarine could operate in the Arctic Ocean.

Battle said deciding when to surface through the Arctic ice was "a very tricky moment," because it was unclear what kind of damage the move would cause the submarine.

"It was a very dramatic moment when he decided to pick the spot and go for it," Battle said. "At the time, it was a major feat."
More...


June 3, 2009

Slip and slide ?


For those that have traveled much in North America what I am about to describe will have more meaning than those who have not, but I hope all can appreciate the scope of what I am trying to convey.

Imagine all of the United States including Alaska and throw in all the United states territorial waters. Add to his about half of Canada, let's say everything from Winnipeg westward. I doubt that is exactly half but this is just for visualization purposes.

Now imagine all that area pretty much covered in ice. I am not talking about skim ice on a puddle here, I'm talking serious deep glacier type ice. The kind of ice that if you live in Denver a mile high you are still buried almost a mile deep under ice. From San Diego to Portland Maine, from Miami to Anchorage, pretty much just ice. Oh it may not all be as deep as in Denver, but you would still be snow boarding in Malibu not surfing.

That is what Antarctica is, 14,000,000 sq kilometers of mostly ice. The thought of it melting ought to put the fear of Gore in you for sure. But think for a moment how likely is that to actually happen? Let me point out some reality of that actually happening.

I read a fascinating article from the BBC called
Origin of Antarctic ice revealed . A very interesting article about the scientific expedition which is taking radar images of the land under the Antarctic Ice Sheet. Reading it however I was once again reminded how absolutely disingenuous the entire alarmist version of global warming is. It makes me even wonder how not only people like Al Gore but more importantly so called scientist who promote the alarmist view can live with themselves. How a person knowing the actual dynamics of Antarctica could prostitute themselves to promote the fear mongering of sea level catastrophes caused by this remotest of possibilities in the name of science is beyond belief but not beneath contempt.

I will excerpt some passages from the article to make my point, but as I do remember the size and scope of what we are talking about here. To give you another mental picture I will excerpt a portion of the article, remembering that these scientific explorers are making there was across a vast white waste land of snow and ice:

Their radar revealed a landscape that, 14 million years ago, looked similar to the European Alps.
That is what they see through the ice below them, you could replace the Alps with the Rockies, that gives you an idea of the depth of the ice. Another mental picture here:

Dr Siegert said the research team was "very lucky" to see such a clear image of the underlying landscape. They discovered a whole valley system - with mountains at the edge of the survey region and the valley in the middle.


To put this in a bit more perspective, they are in tracked vehicles making their way across the vast white continent not unlike taking a trip from New Orleans to Seattle, the scenery somewhat less picturesque of course and fewer McDonald's. What they are recording would be similar to the area you could map on such a trip in North America, a very small fragment of the immense continent.

Now let's get to the gist of it:


By looking at ancient climate patterns, scientists have previously estimated that the East Antarctic ice sheet formed around 14 million years ago, burying and preserving the Gamburtsev mountain landscape under ice that is now up to 3km thick.

"You need a mean annual temperature of about 3C for the glaciers to form the way they did," Dr Siegert told BBC News.


"The mean annual temperature in this region now is -60 C. So we believe that these mountains are relics of [glacial erosion] in Antarctica before the ice sheet was in place."


Perhaps you get an idea of the insincerity of the alarmist view of melting ice sheets and rising sea levels when the current temperatures are over 60 degrees colder than what was necessary to start the ice growth. What is Antarctica as a whole like, annual temperature wise? There has been much debate about this lately whether temperatures are rising or not, but the fact is that if the ice is not going to melt, it really does not matter now does it? I'll just take an official map from NSIDC to give you an idea of what Antarctica annual temperatures are like, warming or not.


Look at those average annual mean temperatures, keeping in mind the preceding statement from Dr. Siegert "You need a mean annual temperature of about 3C for the glaciers to form the way they did"

How much would temperatures have to rise to even begin to have an affect on Antarctica? How can ice melt in an environment where the mean annual temperatures are far below the freezing point of water? It is absurd to even suggest that temperature increases of a couple of degrees centigrade are going to have any appreciable affect in such an environment. Of course the scientist have to point out the possible threat we face, well sort of:


He added that the findings provided an insight into the stability of the ice.


"It is a critical part of our Earth's system," said Dr Ferraccioli. "If the whole ice sheet collapsed, sea levels would rise by 60m."


There is that now popular scientific term "if". What he says about the stability of the ice sheets is interesting, since one of the alarmist positions is that the ice sheet could somehow slide into the sea or as he says collapse. The idea that such a vast ice sheet which is embedded into continental scale Alp like mountain ranges and valleys is somehow going to slide into the ocean is ludicrous. Imagine our make believe ice sheet over North America stretching across the terrain of the Rockies to the Appalachians suddenly sliding into the Gulf of Mexico, ridiculous. After 14 million years of ice formation we suddenly have continental slip and slide-right. Even if temperatures increased remarkably more than the most dire predictions of the science fiction fantasy world of the computer modellers, the vast majority of Antarctica would remain a frozen continent. The idea of a collapsing ice sheet in such an environment is not only beyond belief, it is irresponsible to even raise it as a possibility less alone promote it and use it a a tool to foster an agenda of fear.


"There's been a lot of climate change over the last 14 million years," Dr Siegert said. "And what we can say about this place in the middle of the Antarctic is that nothing has changed."

But, he warned, if levels of atmospheric carbon dioxide continued to rise, in around 1,000 years they will approach the same levels that existed "before there was persistent ice sheet in Antarctica".


"This puts the ice sheet into the context of global climate and what conditions are needed to grow an ice sheet," explained Dr Siegert. "The worrying thing is that we seem to be going back to carbon dioxide concentrations consistent with there being a lot less ice around."


So over the past 14 million years (since ice first began forming in Antarctica) we have experienced many climate changes, I would say that is an understatement. However during all these many climate changes the ice just kept on growing until we invented the internal combustion engine-remarkable. But if we don't do something soon or in around a 1000 years, we will have as much CO2 in the atmosphere as we did when there was no ice in Antarctica.

The little hitch in the get along though is that something amazing happens when a continent is at the bottom of the Earth, it goes a long time without much sun. This little detail insures a very cold environment, CO2 or no CO2.


Of course this line "The worrying thing is that we seem to be going back to carbon dioxide concentrations consistent with there being a lot less ice around." is only relevant if that nasty CO2 stuff raises the temperatures far beyond anything predicted so that a frozen continent is no longer frozen, with or without sun half the year. In which case we are all toast long before that anyway.


And they wonder why the more people know, the less people believe in this nonsense.


More...


"It's getting deep in here"


"Noah managed to survive the great flood. I think we will survive the minor flood even if it does occur. "

FROM- American Chronicle

Rising Waters or Rising Rhetoric?

Government, Inc., is in full stride on a broad front to reduce carbon emissions so the world will be safe from the rising oceans, at least so goes the theory. Of course those bright p0liticians in Washington assure us it is not a theory but an established scientific fact that carbon emissions will cause the temperatures to rise and that the ice caps will melt and inundate the low lying regions of the world. We are assuming that they are only talking about the ice caps on Greenland and Antartica. The floating ice at the North Pole and those at the South Polar region will not add one inch to the ocean level even if they did melt entirely since they are already in the water. (When you have a glass of iced tea and the ice cubes melt the level in the glass does not rise and the same is true with the floating ice caps.)

Let's think through some of these assumptions they are making even if we aren't blessed with PhD's in climatology. Firstly, it should be remembered that the ice caps on Greenland and Antartica comprise about 2% of the total water on the planet. Only 3% of all the water on earth is fresh water, 97% is in the oceans already. All of the ice in those two spots will not melt. Maybe quite a bit of it but not all of it. Unless the earth flips or its tilt is dramatically altered those regions will always be very very cold because they have little sunlight during their respective winters. Those regions will remain cold for eons and much of the ice will remain and there will be future snow falls to replenish some of the ice. The earth was at one time totally dry and nothing but volcanic action and deserts existed; that was caused by the turmoil deep within the earth itself, not from the atmosphere. If all of the ice melts it would be due to other factors than carbon emissions. Something dramatic would have occured to the geology of the earth or its configuration in the heavens. In that event carbon emissions would be the least of our worries. We would all be dead.

I would like some very hard data from the bright guys giving their estimate about how much of the ice will in fact melt if their predictions are corret. We should all be allowed to see their data and then their conclusions. If half the ice remains then we are talking about a 1% increase in the total volume of water in the oceans. But that over states the case because a certain percentage of that water would be in the form of water vapor. That increase in water vapor will add to the snow fall amounts somewhere. There will always be an area of the earth that will be cold because it is away from the Sun. But assume it is 1% then how will that affect the ocean levels around the world?

The earth is not perfectly round. It is egg shaped and furthermore the polar regions are flattened. Folks figured that out a few centuries ago before slide rules or computers were available. The distribution of the new water would not be evenly spaced everywhere on earth. Don't forget that the Moon has a tremendous influence on the oceans and the levels of them--ever heard of the tides? We also have to consider that for every action there is a reaction. As the volume of water was reduced on Greenland and Antartica the tremendous weight of that water would be reduced and those land masses would rise and I betcha there would be an offsetting deflection in the earth somewhere for that rise. That lowering of the earth's crust would take up at least some of the increased volume of water. That is basic geology and physics. I don't think carbon emissions will change those. Our crustal suface is only a few miles deep relative to the diameter of the earth. Mostly the interior is molten iron sloshing about. Thank goodness it does slosh about because that is what gives us our magnetic field which in turn is what protects us from the harmful radiations from the Sun; without that magnetic field we would die.

Assume the depth of the ocean off the Browery in New York Harbor is 100 feet right now. A 1% increase would be one foot. I don't think that would flood Manhattan. That assumption is based on a completely even distribution of the new melt water over the earth which is unlikely but a worse case scenario is ok. There would be some benefits too if the worst occurs. If great chunks of Greenland become ice free and the temperatures rise it would be ripe for food production as would a great many other areas of the world that were barren or ice bound. Siberia would become the new grain belt of the world.

I have an open mind on these matters but I want details, not conclusions and certainly not political posturing about this issue. What I don't like now is that is what we are getting. We are told temperatures are rising. Well, don't tell me that, show me the data. Is the temperature rising in Albany, Springfield, Arles, Munich, Darwin, etc.? What is the time period used? Lastly what is different about any rise in temperature this time that is different than those we have seen before. You historians will recall that the earth was quite warm during the Roman Empire days and the time of Jesus. All those people ran around with capes and togas. England at that time was one of the prime wine producing regions of the civilized world. Was it carbon emissions of that very small population that caused such a spike in temperatures then? I have questions. I learned long ago not to take as the gospel everything said by a pundit or a PhD with an agenda. Maybe they are right, maybe they are wrong. We are investing trillions and gambling our economy on those conclusions that I am not sure about.

Noah managed to survive the great flood. I think we will survive the minor flood even if it does occur.

More...


May 26, 2009

Just another surprise


If as this article from Mother Jones and the corresponding report states, 30% of the warming in the Arctic region is the result of soot rather than demonic CO2, where does that leave recent "unprecedented warming"? In addition the fact that soot is responsible for greater and accelerated ice melt, it makes one wonder how the scientific community can continue with a clear conscious to blame the Arctic sea ice melt on atmospheric CO2. So once again we have another example of the so called settled science being unsettled by new discoveries. The best and the brightest of the climate science community are regularly being surprised by what they don't know, it makes you wonder why they are surprised that fewer and fewer people trust what they say.

After all how often do we have tor read something like :"These fires weren't part of our standard predictions, they weren't in our models," before it dawns on them that the science community is not being all that scientific.

FROM-Mother Jones


Don't Burn the Crops


Want a quick recipe for reducing Arctic ice melt fast? Stop burning northern hemisphere farmlands and pasturelands.

New research finds that large-scale agricultural burning in Russia, Kazakhstan, China, the US, Canada, and the Ukraine is melting Arctic ice.

The big contributor: Spring burning, when farmers torch crop residues and brush to clear new land for crops and livestock. The black carbon soot produced by these fires flows north, warms the surrounding air, and absorbs solar energy when it falls on ice and snow.

How bad is the problem? Springtime burning may account for 30 percent of Arctic warming to date. The good news is there's an easy fix. Targeting these burns gets us a genuinely fast reduction in temperature over the Arctic. Plus we know how to control these pollutants right now. Just stop burning. Right now. Before the melting ice rewires the oceanic currents delivering us the climate we're used to.

The research is part of POLARCAT, an international effort to track the transport of pollutants into the Arctic from lower latitudes. Researchers were surprised to find 50 smoke plumes that analysis of satellite images revealed came from agricultural fires in Northern Kazakhstan and Southern Russia and from forest fires in Southern Siberia. The emissions from these fires far outweighed those from fossil fuels.

"These fires weren't part of our standard predictions, they weren't in our models," says Daniel Jacob, a professor of atmospheric chemistry and environmental engineering at Harvard.

Although global warming is largely the result of excess accumulation of carbon dioxide, the Arctic is highly sensitive to short-lived pollutants like black carbon. Forest fires, agricultural burning, primitive cookstoves, and diesel fuel are the primary sources of black carbon.

More...


May 17, 2009

POWER TO THE PEOPLE

Letters to the Editor and other People Speak


FROM-Albany Democrat-Herald
Letter: Sea ice comes and sea ice goes

Andreas Schmittner has recently commented twice on declining Arctic sea ice extent, noting particularly the 2007 record low and 2008 as the second lowest. Twice Dr. Schmittner failed to note the rapidity of the 2008 ice recovery, continuing in 2009 so that Arctic sea ice extent now nearly matches the 1979-2000 average.

NASA determined the 2007 record low resulted from unusual prevailing winds blowing the Arctic ice into the Atlantic and was not the result of global warming. Dr. Schmittner claims that the main cause of sea ice melting is increasing carbon dioxide, and presumably its warming potential. Why does he believe this? Because his computer model requires it. However, the Atlantic Multidecadal Oscillation (AMO) has much more influence on sea ice than a gas that’s only 0.038 percent of the atmosphere.

NOAA’s website describes the AMO as “…an ongoing series of long-duration changes in the sea surface temperature of the North Atlantic Ocean, with cool and warm phases that may last for 20-40 years at a time … These changes are natural and have been occurring for at least the last 1,000 years.”

When the AMO index is positive the Atlantic is warmer, when it’s negative it’s cooler. The AMO index turned positive in the 1990s and declining sea ice extent correlates well with this warm phase, much more so than with CO2 levels (see chart: http://img133.imageshack.us/img133/8510/nhse72anomamo.png).

The AMO index turned negative in late 2007 and — surprise! — the decline in sea ice extent was reversed. The Arctic and Antarctic Research Institute (AARI) in Saint Petersburg, Russia, is forecasting years of increasing sea ice extent because they know the AMO cycle will continue unabated, CO2 notwithstanding.


More...


Running out of time


FROM-Talking About Weather

Arctic Cooling Has Begun


What follows is the first guest post on Talking About The Weather. I chose Peter Taylor’s short essay on the Arctic out of respect for Peter’s research, his calm during intense debates, and the focus he brings to the issues. As Peter makes clear, those “banking” on rapid Arctic sea ice deterioration in the decades ahead seem to know very little about climate cycles. — Harold

I hope to be around in 2020, when some have suggested those of us on the sceptics’ side should have been vindicated, but I think we will prevail much sooner. The Arctic heat-wave of 1920-1940 is of course well-known to real Arctic climate scientists. I reviewed 32 temperature data sets for Arctic stations to 2004 some with very long records. In 2006 I could find only one with higher temperatures in 2004 than in the late 1930s or early 1940s – that was on the eastern


Fear-mongering regarding Arctic sea ice is the most acute of all that brought forward by global warming doomsayers. Image courtesy of the USGS.
coast of Greenland. Since then I have reviewed dozens of papers on surface air temperature, sea surface temperatures, ice-mass, glacier speeds and sea-ice, and all show a clear cyclic pattern of roughly 70 years. Some Greenland and Alaskan temperatures peaked in 2006-2008, but the pattern looks set to repeat.


The latest Arctic heat wave is not identical to the last – firstly it is higher, by maybe 20% in some places, and secondly, the hot-spots are different. But one thing is clear – it is driven by two distinctive factors – a 14% increase in clouds over

the North Pole and Beaufort Sea between 1980-2000, and the incursion of warm Atlantic water under the ice and into the Beaufort Gyre. The rapid summer ice loss is due to melting from above (infra red from the clouds) and below (warm Atlantic water).

The strength of the Beaufort Gyre determines how far Atlantic water penetrates the Arctic – when the Pacific Decadal Oscillation is warm and Alaskan Shelf winds are low, the gyre weakens and may reverse flow; when cold (as it has been since late 2006), the Alaskan interior cools, the winds strengthen and the gyre strengthens accordingly – there is a lag of a few years.

Thus, this domino effect from the Pacific will eventually reach the area between Greenland and Norway and summer sea-ice ought to return to the long-term norm (unless there really is a strong greenhouse element – which I can’t see it greater than the difference between this warm period and the last – ie about 20%) and unless there is an even steeper decline in global temperatures due to the quiet sun effect.

On the latter – there is a body of evidence that during quiet solar periods, the jetstream is shifted along with Arctic pressure systems that lead to blocking high pressure over Iceland – sending the jetstream further south and cooling western Europe. The eastern seaboard of the USA gets a little warmer, but the mid-West suffers late springs, dry summers, and bitter winters – not good for the breadbasket of the world!

We should get to see this play out over the next five years.

More...