
Showing posts with label Graphs and Charts. Show all posts
Showing posts with label Graphs and Charts. Show all posts
December 13, 2010


November 17, 2010

August 3, 2009

July 19, 2009

July 17, 2009
June 5, 2009

May 31, 2009
May 30, 2009

May 15, 2009

May 11, 2009

May 10, 2009
IMAGE OF THE DAY
FROM-Climate 4 You
click for larger view
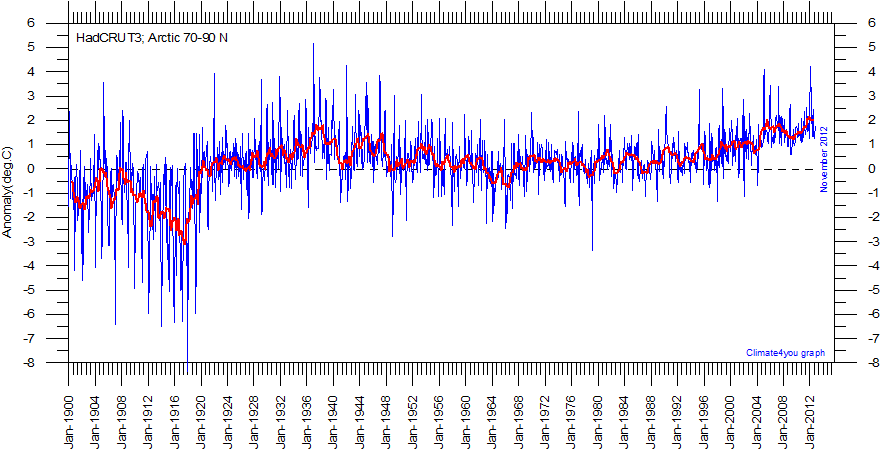
Diagram showing Arctic monthly surface air temperature anomaly 70-90oN since January 1900, in relation to the WMO normal period 1961-1990. The thin blue line shows the monthly temperature anomaly, while the thicker red line shows the running 13 month average. In general, the range of monthly temperature variations decreases throughout the first 30-50 years of the record, reflecting the increasing number of meteorological stations north of 70oN over time. Especially the period from about 1930 saw the establishment of many new Arctic meteorological stations, first in Russia and Siberia, and following the 2nd World War, also in North America. Because of the relatively small number of stations before 1930, details in the early part of the Arctic temperature record should not be over interpreted. The rapid Arctic warming around 1920 is, however, clearly visible, and is also documented by other sources of information. The period since 2000 is warm, about as warm as the period 1930-1940. Diagrams showing more recent variations of Arctic temperatures north of 70oN in greater detail are shown here, here and here. Data source: HadCRUT3 temperature data from the Climatic Research Unit (CRU). Last month shown: March 2009. Last diagram update 9 May 2009.
More...
click for larger view
Diagram showing Arctic monthly surface air temperature anomaly 70-90oN since January 1900, in relation to the WMO normal period 1961-1990. The thin blue line shows the monthly temperature anomaly, while the thicker red line shows the running 13 month average. In general, the range of monthly temperature variations decreases throughout the first 30-50 years of the record, reflecting the increasing number of meteorological stations north of 70oN over time. Especially the period from about 1930 saw the establishment of many new Arctic meteorological stations, first in Russia and Siberia, and following the 2nd World War, also in North America. Because of the relatively small number of stations before 1930, details in the early part of the Arctic temperature record should not be over interpreted. The rapid Arctic warming around 1920 is, however, clearly visible, and is also documented by other sources of information. The period since 2000 is warm, about as warm as the period 1930-1940. Diagrams showing more recent variations of Arctic temperatures north of 70oN in greater detail are shown here, here and here. Data source: HadCRUT3 temperature data from the Climatic Research Unit (CRU). Last month shown: March 2009. Last diagram update 9 May 2009.
More...
April 29, 2009

April 13, 2009
April 11, 2009


April 10, 2009
Ice Skating Anyone?

via Dalton Minimum Returns
from StormX
Solar Activity Lowest in Almost 100 Years, Implications for Climate Potentially Significant
......Over the past several years, the sun has been entering another minimum in the 11-year sunspot cycle. However, the unforeseen and lingering absence of sunspots during the past year has raised concerns that another period like the Dalton Minimum could occur. The number of sunspots in 2008 was the 7th fewest since 1749, averaging only 2.9 sunspots/day. The most recent year with fewer sunspots was 95 years ago in 1913. Sunspots during the first three months of 2009 have remained exceptionally low, averaging only 1.2 sunspots/day. If this inactivity would persist throughout 2009, it would rank as the 2nd fewest since 1749, trailing only 1810 when no sunspots were observed......
March 23, 2009
"Taking on the Man....Yeah"

Earlier this month, the Heartland Institute sponsored the 2009 International Conference on Climate Change in New York. The Conference differed from most such events in that it was devoted to science, not politics or propaganda. Heartland has now made the materials presented at the conference available online, here. You can review the agenda, watch videos of the keynote presentations, read transcripts of some of the speeches, and see the Power Points that were presented by the speakers. More information will be posted as it becomes available.
These are a few of the many slides that I found interesting. This one, by Dennis Avery, puts the climate swings of the last 12,000 years (i.e., since the last Ice Age) in perspective;

This one, by Syun Akasofu, also takes a long-term view, and compares the politically-driven prediction by the UN's IPCC with the historical trend as the earth has recovered from the Little Ice Age..........
March 22, 2009
"I'm glad I didn't pay for college"
from The Daily Galaxy
MIT Scientists Ask: Is Global Warming Part of a Natural Cycle?
Humm??? Is that a trick question?
MIT Scientists Ask: Is Global Warming Part of a Natural Cycle?
Humm??? Is that a trick question?
******************************
A team of MIT scientists recorded a nearly simultaneous world-wide increase in methane levels -the first increase in ten years. What baffles the team is that this data contradicts theories stating humans are the primary source of increase in greenhouse gas. It takes about one full year for gases generated in the highly industrial northern hemisphere to cycle through and reach the southern hemisphere. Since all worldwide levels rose simultaneously throughout the same year, however, it is probable that this may be part of a natural cycle - and not the direct result of man's contributions.
MIT's Matthew Rigby and Ronald Prinn, the TEPCO Professor of Atmospheric Chemistry in MIT's Department of Earth, Atmospheric and Planetary Science, state that this imbalance has resulted in several million metric tons of additional methane in the atmosphere. Methane is produced by wetlands, rice paddies, cattle, and the gas and coal industries, and is destroyed by reaction with the hydroxyl free radical (OH), often referred to as the atmosphere's "cleanser."
Methane accounts for roughly one-fifth of greenhouse gases in the atmosphere, though its effect is 25x greater than that of carbon dioxide. Its impact on global warming comes from the reflection of the sun's light back to the Earth. Methane is broken down in the atmosphere by the free radical hydroxyl (OH), a naturally occuring process. This atmospheric cleanser has been shown to adjust itself up and down periodically, and is believed to account for the lack of increases in methane levels in Earth's atmosphere over the past ten years despite notable simultaneous increases by man.
Prinn has said, "The next step will be to study [these changes] using a very high-resolution atmospheric circulation model and additional measurements from other networks. The key thing is to better determine the relative roles of increased methane emission versus [an increase] in the rate of removal. Apparently we have a mix of the two, but we want to know how much of each [is responsible for the overall increase]."
The primary concern now is that while the collected data in 2007 reflects a simultaneous world-wide increase in emissions, how relevant are any of the data findings at this late date?
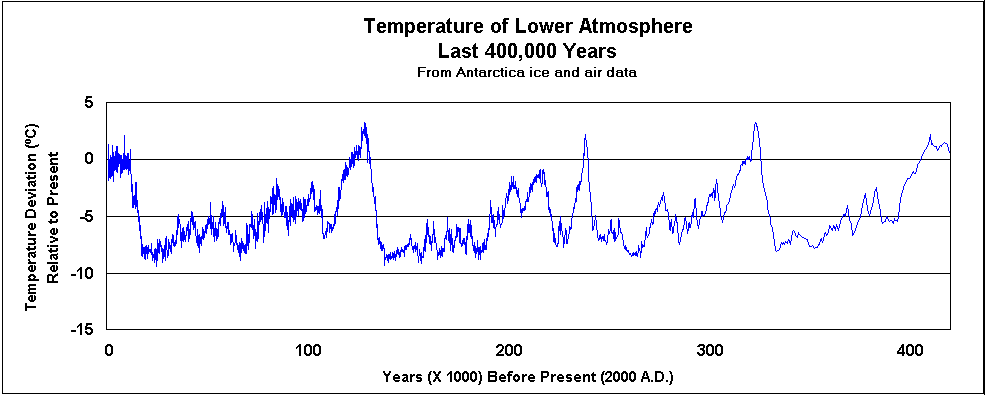
One thing does seem very clear, however; science is only beginning to get a focus on the big picture of global warming. Findings like these tell us it's too early to know for sure if man's impact is affecting things at "alarming rates." We may simply be going through another natural cycle of warmer and colder times - one that's been observed through a scientific analysis of the Earth to be naturally occurring for hundreds of thousands of years.
Wow I guess the writer of the article didn't go to college either! Wonder if them MIT boys are thinking the same thing! Perhaps they ought to go down the hall and talk to Richard
March 20, 2009
Graphs and Charts
One of my favorite temperature graphs from one of the very best sites on the internet Climate 4 You by Ole Humlum
(ckick image for larger view)
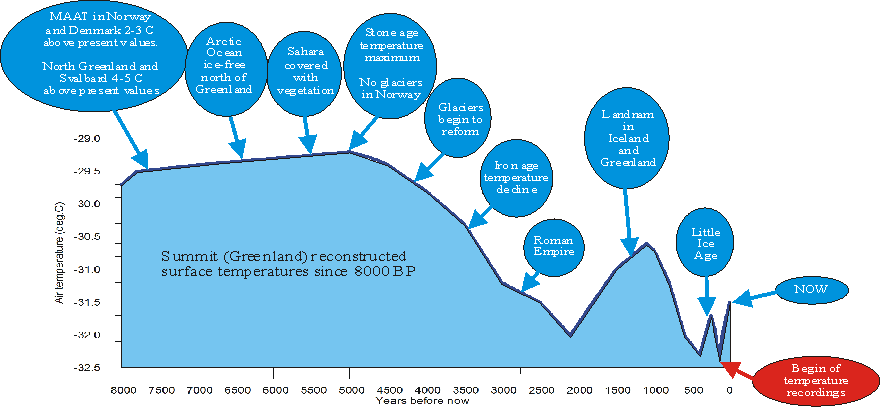
Generalised temperature diagram based on temperature measurements in the Greenland Ice Sheet (Dahl-Jensen et al. 1998), annotated with a number of historical events around the North Atlantic. MAAT is short for mean annual air temperature. Some of the text in the diagram contains links to additional information.
(ckick image for larger view)
Generalised temperature diagram based on temperature measurements in the Greenland Ice Sheet (Dahl-Jensen et al. 1998), annotated with a number of historical events around the North Atlantic. MAAT is short for mean annual air temperature. Some of the text in the diagram contains links to additional information.
Subscribe to:
Posts (Atom)