Pages

Showing posts with label sun. Show all posts

December 15, 2010

Climate Change: It's the Sun, Stupid


FROM-American Thinker

Randall Hoven


Guess who wrote this.

"The Sun is the primary forcing of Earth's climate system. Sunlight warms our worldSunlight drives atmospheric and oceanic circulation patterns. Sunlight powers the process of photosynthesis that plants need to grow. Sunlight causes convection which carries warmth and water vapor up into the sky where clouds form and bring rain. In short, the Sun drives almost every aspect of our world's climate system and makes possible life as we know it.

"... According to scientists' models of Earth's orbit and orientation toward the Sun indicate that our world should be just beginning to enter a new period of cooling -- perhaps the next ice age...

"Other important forcings of Earth's climate system include such "variables" as clouds, airborne particulate matter, and surface brightness. Each of these varying features of Earth's environment has the capacity to exceed the warming influence of greenhouse gases and cause our world to cool. " [Emphases added.]

Lord Monckton didn't write that. Neither did physicist Richard Lindzen, physicist William Happer, or physicist Hal Lewis. Nor was it Steve McIntyre who blew the whistle on the "hockey stick." It was none of the usual suspects among the "skeptic" community.

It was NASA, home of our space program, the currently unmuzzled James Hansen and one of the major centers for collecting climate data and analyzing it. (HT: Ace.)

The NASA statement is simply astounding to me. It says, quite unambiguously, that our climate is dominated by the sun and our orientation to it. It also credits non-carbon sources as "important forcings" of our climate: clouds, particulate matter and surface brightness. Finally, it warns of coming global cooling!

Of course, the NASA statement still says there is human-caused warming. But, it will be swamped by these other forces to yield net cooling. In short, whatever man is doing to the climate, it is insignificant in the face of natural forcings.

The science "consensus" has not only collapsed, it has raised the white flag and confessed that the skeptics were right all along. I think we can stick a fork in the climate change agenda. A few nuts will continue to wander the streets, mumbling to themselves and each other. But as a significant political agenda, I think it's over. I sure hope it is.

January 14, 2010

Climategate: How to Hide the Sun


FROM-American Thinker

By Dexter Wright

The Climategate crowd successfully worked to obscure the connection between solar activity and climate. The leaked CRU e-mails reveal how.

In 2003, two Harvard-Smithsonian Professors, Willie Soon and Sallie Baliunas, published a peer-reviewed paper in the scientific journal Climate Research which identified solar activity as a major influence on Earth's climate. This paper also concluded that the twentieth century was not the warmest, nor was it the century with the most extreme weather over the past thousand years. These two scientists reviewed more than two hundred sources of data. The paper specifically examined climate variations observed to coincide with solar variations. One of the more notable correlations cited in this paper is the well-documented coincidence of the Little Ice Age and a solar quiet period, known as the Maunder Minimum, from A.D. 1300 to A.D. 1900. Soon and Baliunas asserted that the lack of solar activity resulted in cooler temperatures across the globe. The evidence they compiled also indicated that as the sun became more active global temperatures began to rise and the Little Ice Age ended.

In the past, the issue of the solar connection has always fallen down on one question; what is it about sunspots that cause a change in the climate? Soon and Baliunas identified the physical connection as solar wind, which varies on an eleven-year cycle similar to sunspots'. The solar wind is made up of high-energy particulate radiation and when strong enough, it has a visible effect upon the atmosphere in the form of auroral displays in the polar regions (e.g., the Northern Lights). Some instances of solar wind were so powerful that the aurora was seen even in lower latitude, as happened during the Battle of Fredericksburg, Virginia during the War Between the States (Civil War). Both armies were so distracted by the intensity of the display that the battle actually paused as the soldiers, North and South, watched in awe.

With such convincing evidence, the Soon and Baliunas paper became the target of a great deal of criticism from the gang led by the now-discredited Dr. Jones of the Climate Research Unit (CRU) at East Anglia University in Britain. The recently uncovered e-mails from him and his collaborators show an orchestrated effort to discredit the work of these two scholars.

What is also notable is that Soon's and Baliunas's references were the very same data that the Jones Gang had reviewed and suppressed. The data in question is known as proxy data. Proxy data is data compiled from tree rings, sediments, and ice cores, as well as other indirectly measured estimates of temperature. Correlating an accurate timeline for these data sets across the globe is supremely difficult, but these proxy data sources were beginning to indicate a cycle or signal which might expedite the process. This signal was thought by some in the Jones Gang to be a solar cycle.
The discussion of solar influences is brought up in an e-mail from Dr. Daly, dated 9 August 1996. Dr. Daly uncovered an eleven-year signal in the temperature data set from the island of Tasmania. He found this signal by using a mathematical signal analysis formula known as a Fourier Transform. It is clear from the tone of his e-mail that he knows this is not welcome news, but he goes on to state the following concerning the temperature data set compiled by the Jones Gang:

(I tried the same run [Fourier Transform] on the CRU global temperature set. Even though CRU must be highly smoothed by the time all the averages are worked out, the 11-year pulse is still there, albeit about half the size of Sydneys).
The eleven-year cycle corresponds exactly with the one observed on the sun. This fact was kept secret by the Jones Gang.

The eleven-year cycle corresponds exactly with the one observed on the sun. This fact was kept secret by the Jones Gang.

Correlating the timeline of these proxy data was identified as problematic by Dr. Wigley, another member of the Jones Gang, in an e-mail dated 12 Aug 1996. In his effort to correlate the data, Dr. Wigley concludes that the solar signal is strong enough to convince him that solar forcing is a major factor in climate change:


(4) Causes. Here, ice cores are more valuable (CO2, CH4 and volcanic aerosol changes). But the main external candidate is solar, and more work is required to
improve the "paleo" solar forcing record and to understand how the climate
system responds both globally and regionally to solar forcing.


What is significant about this paragraph is that it identifies the main cause of climate change as "solar forcing," not carbon dioxide (CO2). This fact was also kept secret.

Remarkably, this was exactly what Soon and Baliunas published in their Climate Research paper. The solar correlation became a lightning rod. More than a dozen e-mails from the Jones Gang discuss how to discredit Soon and Baliunas. Ultimately, the gang decide to compile a new paper to counter the conclusion made by Soon and Baliunas, as detailed in an e-mail from Dr. Scott Rutherford dated the 12 March 2003. Dr. Rutherford does not go head-to-head with the data presented in the Climate Research paper, but he seemingly wishes to "cook" other data to counter the honest work of Soon and Baliunas, as stated by the following:

First, I'd be willing to handle the data and the plotting/mapping. Second, regarding Mike's suggestions, if we use different reference periods for the reconstructions and the models we need to be extremely careful about the differences. Not having seen what this will look like, I suggest that we start with the same instrumental reference period for both (1xxx xxxx xxxx). If you are willing to send me your series please send the raw (i.e. unfiltered) series. That way I can treat them all the same. We can then decide how we want to display the results.

Dr. Rutherford goes on to suggest that Soon and Baliunas should be dealt with severely:


... there is nothing we can do about them aside from continuing to publish
quality work in quality journals (or calling in a Mafia hit).

It seems clear that the Jones Gang felt threatened by the Climate Research paper. By all appearances, they saw the threat as significant enough to consider the scientific equivalent of evidence-tampering in order to hide the sun. Is this the kind of reaction we would expect from scientists interested in the truth? Or is it what we would expect from the infamous Mafioso John Gotti?

Perhaps William Shakespeare said it best in his famous play of conspiracy and intrigue, Hamlet: "The lady doth protest too much, methinks."


More...


September 1, 2009

Global warming and the sun


Recent studies seem to show that there's more to climate change than we know.

By Jonah Goldberg

FROM-LAT

Assuming there are no sunspots today, a 96-year record will have been broken: 53 days without any solar blemishes, giant magnetic disruptions on the sun's surface that cause solar flares. That would be the fourth-longest stretch of stellar solar complexion since 1849. Wait, it gets even more exciting.

During what scientist call the Maunder Minimum -- a period of solar inactivity from 1645 to 1715 -- the world experienced the worst of the cold streak dubbed the Little Ice Age. At Christmastime, Londoners ice skated on the Thames, and New Yorkers (then New Amsterdamers) sometimes walked over the Hudson from Manhattan to Staten Island.

Of course, it could have been a coincidence. The Little Ice Age began before the onset of the Maunder Minimum. Many scientists think volcanic activity was a more likely, or at least a more significant, culprit. Or perhaps the big chill was, in the words of scientist Alan Cutler, writing in the Washington Post in 1997, a "one-two punch from a dimmer sun and a dustier atmosphere."

Well, we just might find out. A new study in the American Geophysical Union's journal Eos suggests that we may be heading into another quiet phase similar to the Maunder Minimum.

Meanwhile, the journal Science reports that a study led by the National Center for Atmospheric Research, or NCAR, has finally figured out why increased sunspots have a dramatic effect on the weather, increasing temperatures more than the increase in solar energy should explain. Apparently, sunspots heat the stratosphere, which in turn amplifies the warming of the climate.

Scientists have known for centuries that sunspots affected the climate; they just never understood how. Now, allegedly, the mystery has been solved.

Last month, in another study, also released in Science, Oregon state researchers claimed to settle the debate over what caused and ended the last Ice Age. Increased solar radiation coming from slight changes in the Earth's rotation, not greenhouse gas levels, were to blame.

What is the significance of all this? To say I have no idea is quite an understatement, but it will have to do.

Nonetheless, what I find interesting is the eagerness of the authors and the media to make it very clear that this doesn't have any particular significance for the debate over climate change. "For those wondering how the [NCAR] study bears on global warming, Gerald Meehl, lead author on the study, says that it doesn't -- at least not directly," writes Moises Velasquez-Manoff of the Christian Science Monitor. "Global warming is a long-term trend, Dr. Meehl says. ... This study attempts to explain the processes behind a periodic occurrence."

This overlooks the fact that solar cycles are permanent "periodic occurrences," a.k.a. a very long-term trend. Yet Meehl insists that the only significance for the debate is that his study proves that climate modeling is steadily improving.

I applaud Meehl's reluctance to go beyond where the science takes him. And for all I know he's right. But such humility and skepticism seem to manifest themselves only when the data point to something other than the mainstream narrative about global warming. For instance, when we have terribly hot weather, or bad hurricanes, the media see portentous proof of climate change. When we don't, it's a moment to teach the masses how weather and climate are very different things.

No, I'm not denying that man-made pollution and other activity have played a role in planetary warming since the Industrial Revolution.

But we live in a moment when we are told, nay lectured and harangued, that if we use the wrong toilet paper or eat the wrong cereal, we are frying the planet. But the sun? Well, that's a distraction. Don't you dare forget your reusable shopping bags, but feel free to pay no attention to that burning ball of gas in the sky -- it's just the only thing that prevents the planet from being a lifeless ball of ice engulfed in total darkness. Never mind that sunspot activity doubled during the 20th century, when the bulk of global warming has taken place.

What does it say that the modeling that guaranteed disastrous increases in global temperatures never predicted the halt in planetary warming since the late 1990s? (MIT's Richard Lindzen says that "there has been no warming since 1997 and no statistically significant warming since 1995.") What does it say that the modelers have only just now discovered how sunspots make the Earth warmer?

I don't know what it tells you, but it tells me that maybe we should study a bit more before we spend billions to "solve" a problem we don't understand so well.


More...


August 29, 2009

Small Fluctuations In Solar Activity, Large Influence On Climate


Who'd of thunk it? The Sun huh?

FROM-Science Daily

Subtle connections between the 11-year solar cycle, the stratosphere, and the tropical Pacific Ocean work in sync to generate periodic weather patterns that affect much of the globe, according to research appearing this week in the journal Science. The study can help scientists get an edge on eventually predicting the intensity of certain climate phenomena, such as the Indian monsoon and tropical Pacific rainfall, years in advance.


An international team of scientists led by the National Center for Atmospheric Research (NCAR) used more than a century of weather observations and three powerful computer models to tackle one of the more difficult questions in meteorology: if the total energy that reaches Earth from the Sun varies by only 0.1 percent across the approximately 11-year solar cycle, how can such a small variation drive major changes in weather patterns on Earth?

The answer, according to the new study, has to do with the Sun's impact on two seemingly unrelated regions. Chemicals in the stratosphere and sea surface temperatures in the Pacific Ocean respond during solar maximum in a way that amplifies the Sun's influence on some aspects of air movement. This can intensify winds and rainfall, change sea surface temperatures and cloud cover over certain tropical and subtropical regions, and ultimately influence global weather.

"The Sun, the stratosphere, and the oceans are connected in ways that can influence events such as winter rainfall in North America," says NCAR scientist Gerald Meehl, the lead author. "Understanding the role of the solar cycle can provide added insight as scientists work toward predicting regional weather patterns for the next couple of decades."More...
The study was funded by the National Science Foundation, NCAR's sponsor, and by the Department of Energy. It builds on several recent papers by Meehl and colleagues exploring the link between the peaks in the solar cycle and events on Earth that resemble some aspects of La Nina events, but are distinct from them. The larger amplitude La Nina and El Nino patterns are associated with changes in surface pressure that together are known as the Southern Oscillation.

The connection between peaks in solar energy and cooler water in the equatorial Pacific was first discovered by Harry Van Loon of NCAR and Colorado Research Associates, who is a co-author of the new paper.

Top down and bottom up

The new contribution by Meehl and his colleagues establishes how two mechanisms that physically connect changes in solar output to fluctuations in the Earth's climate can work together to amplify the response in the tropical Pacific.

The team first confirmed a theory that the slight increase in solar energy during the peak production of sunspots is absorbed by stratospheric ozone. The energy warms the air in the stratosphere over the tropics, where sunlight is most intense, while also stimulating the production of additional ozone there that absorbs even more solar energy. Since the stratosphere warms unevenly, with the most pronounced warming occurring at lower latitudes, stratospheric winds are altered and, through a chain of interconnected processes, end up strengthening tropical precipitation.

At the same time, the increased sunlight at solar maximum causes a slight warming of ocean surface waters across the subtropical Pacific, where Sun-blocking clouds are normally scarce. That small amount of extra heat leads to more evaporation, producing additional water vapor. In turn, the moisture is carried by trade winds to the normally rainy areas of the western tropical Pacific, fueling heavier rains and reinforcing the effects of the stratospheric mechanism.

The top-down influence of the stratosphere and the bottom-up influence of the ocean work together to intensify this loop and strengthen the trade winds. As more sunshine hits drier areas, these changes reinforce each other, leading to less clouds in the subtropics, allowing even more sunlight to reach the surface, and producing a positive feedback loop that further magnifies the climate response.

These stratospheric and ocean responses during solar maximum keep the equatorial eastern Pacific even cooler and drier than usual, producing conditions similar to a La Nina event. However, the cooling of about 1-2 degrees Fahrenheit is focused farther east than in a typical La Nina, is only about half as strong, and is associated with different wind patterns in the stratosphere.

Earth's response to the solar cycle continues for a year or two following peak sunspot activity. The La Nina-like pattern triggered by the solar maximum tends to evolve into a pattern similar to El Nino as slow-moving currents replace the cool water over the eastern tropical Pacific with warmer water. The ocean response is only about half as strong as with El Nino and the lagged warmth is not as consistent as the La Nina-like pattern that occurs during peaks in the solar cycle.

Enhancing ocean cooling

Solar maximum could potentially enhance a true La Nina event or dampen a true El Nino event. The La Nina of 1988-89 occurred near the peak of solar maximum. That La Nina became unusually strong and was associated with significant changes in weather patterns, such as an unusually mild and dry winter in the southwestern United States.

The Indian monsoon, Pacific sea surface temperatures and precipitation, and other regional climate patterns are largely driven by rising and sinking air in Earth's tropics and subtropics. Therefore the new study could help scientists use solar-cycle predictions to estimate how that circulation, and the regional climate patterns related to it, might vary over the next decade or two.

Three views, one answer

To tease out the elusive mechanisms that connect the Sun and Earth, the study team needed three computer models that provided overlapping views of the climate system.

One model, which analyzed the interactions between sea surface temperatures and lower atmosphere, produced a small cooling in the equatorial Pacific during solar maximum years. The second model, which simulated the stratospheric ozone response mechanism, produced some increases in tropical precipitation but on a much smaller scale than the observed patterns.

The third model contained ocean-atmosphere interactions as well as ozone. It showed, for the first time, that the two combined to produce a response in the tropical Pacific during peak solar years that was close to actual observations.

"With the help of increased computing power and improved models, as well as observational discoveries, we are uncovering more of how the mechanisms combine to connect solar variability to our weather and climate," Meehl says.

The University Corporation for Atmospheric Research manages the National Center for Atmospheric Research under sponsorship by the National Science Foundation.


--------------------------------------------------------------------------------

Journal reference:

Gerald Meehl, Julie Arblaster, Katja Matthes, Fabrizio Sassi, and Harry van Loon. Amplifying the Pacific Climate System Response to a Small 11-Year Solar Cycle Forcing. Science, 2009; 325 (5944): 1114 DOI: 10.1126/science.1172872
Adapted from materials provided by National Center for Atmospheric Research/University Corporation for Atmospheric Research.


August 25, 2009

Where's the CO2 in this?


FROM-Science Alert

North and south melted ice age

A new study indicates that the ice ages may have ended due to warmer summers in the northern and southern hemispheres, not just the northern hemisphere alone as was previously believed.

The study, led by Dr Russell Drysdale from the University of Newcastle's School of Environmental and Life Sciences, was completed by researchers from Australia, Italy, France, Germany and the UK.

"It is already known that wobbles in the Earth's orbit drive the ice-age cycle but there are several theories as to how they do this. The most popular one suggests that ice ages end during a period when the intensity of northern hemisphere summer insolation is greatest," study co-author Dr John Hellstrom, from the University of Melbourne's School of Earth Sciences, said.

The results of the new study, which focused on the end of the penultimate ice age, cast doubt on this theory and suggest that variations in the Earth's axial tilt was the key factor.

Previous research had identified precisely when these orbital "wobbles" occurred, but it had not been possible to accurately date the records of the Earth's response to them, which are found in marine sediment on the ocean floors.

Dr Russell Drysdale said ocean sediment cores contain a wealth of information about past global climate but beyond about 50,000 years ago it is difficult to determine the exact age of these sediments.

"To overcome this, we studied isotope variations in three stalagmites collected from an Italian cave, and found that these variations relate to ocean temperature changes recorded in sediment cores from the nearby sea floor," Dr Drysdale said. "Stalagmites from limestone caves can be very precisely dated using trace amounts of uranium incorporated within their structure."

"We applied the accurate timescale of the stalagmite record to the sea floor sediment data. A key property of sea-floor sediments is that they detect the growth and decay of ice sheets. So we have effectively provided an accurate timescale for the collapse of the ice sheets that ended the penultimate ice age. This collapse started at around 141,000 years ago."

"This is as much as 8,000 years earlier than previously thought - too early to be caused by stronger northern hemisphere summers alone, which is the prevailing theory."

The researchers said the findings support the theory that the changes were linked to increases in the angle of the Earth's tilt.

"At the time the glacial period ended, the Earth's tilt angle was increasing. Higher tilt angles increase the total solar energy reaching the poles of both hemispheres, where the glacial ice sheets are positioned. This makes summers warmer in both hemispheres in a given year," Dr Drysdale said.

"This mechanism has been suggested previously but up until now we have lacked a precisely dated record to test it. Our results support this mechanism and rule out the conventional theory of ice ages being driven by changes in northern hemisphere summer sunlight alone.

"If anything, there are indications that the southern hemisphere may have a more important role than that of the northern hemisphere."

Dr Hellstrom said that improving our understanding of Earth's climate prior to any possible human impacts is important for understanding future climatic changes.

The study was funded by the Australian Research Council and was published in the prestigious scientific journal Science.

More...


August 13, 2009

Looking up for answers


FROM-Objectivist Individualist:

The Sun Controls the Earth's Climate


The source of more or less energy for the Earth is the Sun. The output of UV radiation is particularly variable for the Sun with variations of 0.5 to 0.8%. This UV radiation affects the ozone concentrations in the atmosphere, the energy deposited in the upper atmosphere, and the winds in the upper atmosphere. It affects the amount of sulfur moved from the oceans into the atmosphere, which then affects lower atmosphere cloud cover, which then reflects light back into space. Overall, the energy from the Sun measured by satellites since 1979 has varied by 0.22%. The high to the low energy output were separated by only 7 years. This difference causes a surface temperature difference of at least 0.45 degree C, according to Ian Plimer. He also says the urban warming effect was 0.1 degree C for a total warming of 0.55 degree C. This is about equal to the late 20th Century temperature increase. This was an irradiance variation of about 0.53 Watts/meter squared.

Since most of this period has been one of relatively high solar activity and output, there is reason to believe that longer term measurements will show much larger variations in solar output. If the Sun's irradiance were to be only about 1 to 1.5 Watts/meter squared less than now, we would experience conditions equivalent to the very cold Maunder Minimum of the Little Ice Age. The 23rd Sun cycle was very short, being 10.0 years long rather than the average of 11.1 years, and resulted in a large decrease in solar irradiance. The quiet sunspot Cycle 24 has started and by September 2008 there were 200 consecutive days without sunspots. The very cold Dalton Minimum of the early 1800s was the last time something like this happened. Some astronomers believe that temperatures will start falling due to solar inactivity between 2012 to 2015 and reach a minimum in solar energy in 2040. This will result in the Earth being very cold around the period of 2055 - 2060.

If the temperature of the Earth is primarily due to the Sun's activities, then the other planets should be similarly affected. They are. In 1998, the Hubble telescope discovered that Triton, the moon of Neptune, had warmed since 1989 when a space probe visited it. Measurements on Pluto showed its temperature to have risen 2 degrees C. The Hubble telescope also measured a 1 degree C increase in the temperature of Jupiter in 2006. Mars has been found to have had a temperature increase of 0.65 degrees C between the 1970s and the 1990s, which is very close the 0.7 degree C increase in temperature on Earth in the last century.

Ian Plimer makes a very good case that the Earth's temperature responds primarily to changes in the activity of our Sun. The IPCC computer models greatly underestimate the effects of the Sun and greatly overestimate the effects of CO2 concentrations in the atmosphere. I again strongly recommend Ian Plimer's book Heaven and Earth.

Posted by Charles R. Anderson, Ph.D. at Thursday, August 13, 2009
More...


July 16, 2009

Pigs do fly!

Over at Climate Depot they have posted a link to a most remarkable article. Besides the fact that there is an article about climate that actually discusses the role of the sun and its affect on climate, not once in an entire article about climate are the words carbon dioxide or CO2 mentioned-not even once.


More...


June 16, 2009

June 13, 2009

Cool Sun


FROM-EXAMINER
by-Kirtland Griffin


Why the Sun's wacky orbit affects you- Global Warming?

Planets and Sun are relative in size. Distances are not: Solar System. (2009, June 12). In Wikipedia, The Free Encyclopedia. Retrieved 12:10, June 12, 2009, from http://en.wikipedia.org/w/index.php?title=Solar_System&oldid=295963209


The Moon orbits the Earth. The Earth orbits the Sun along with the rest of the planets. The whole shebang moves within our arm of our Galaxy. But what is this about a Solar orbit? Bear with me while I delve into a bit of astrophysics. It will become clear to you what this means to us and our climate and as a result the policy decisions our politicians are about to inflict on us.


Although the Sun has more than 99% of the mass of the Solar system, the large planets are in control of the torque of the system, about 97%. Since the planets rotate at different speeds and in different orbits with varying length years, the total system is chaotic. The large planets, Jupiter, Neptune, Uranus and Saturn have most of that torque. Their relative positions determine the orbit of the Sun. Most people don't even know the Sun has an orbit so you have just jumped up in the knowledge quotient. To understand the way this works you can go to this Solar Predictor here. Just enter a date and see the result.


The orbit is probably best described as 3 rings inside of a circle but the proper term is an epitrochoid. Several scientists have demonstrated this phenomenon in papers including Fairbridge, Mackey, and Svensmark among others, so it is fairly widely accepted. The entire cycle takes 179 years. Each third of the cycle takes about 59 years. This fits into some other theories that are said to have a ~60year cycle.The position of the Sun in this cycle is indicative of the Solar activity. When the Sun is in the outer circle it is furthest from the center of the mass of the solar system, is moving faster by a factor of about 2 times and is most active. This translates into a warmer climate here on Earth as we saw in the 80's and 90's. As the Sun starts to dive into the center of the orbit pattern in a rather smaller, tighter loop. It approaches the center of mass of the Solar system,Solar activity decreases along with it's velocity, and climate on Earth cools. For those of you who have been keeping up with the latest global temperature, you are aware that the Earth is cooling recently. The Sun is just entering one of the tighter loops. What a coincidence! Did these scientists look for a cause of the cooling? No, they didn't. This was predicted back in the early 90's, long before there was any hint of a cooling trend. Actually, it was at the height of the warming frenzy. How inconvenient!


Now, given this piece of the puzzle, wouldn't it be just easier to say, "Man make CO2, we're all gonna die!" There is a law of logic that says that for every problem there is an easy to understand, reasonable, wrong answer. There is also an impossible to understand, implausible, correct answer. I cannot tell you the number of times I have seen analyses of problems in my work where the easy answer is accepted in favor of the more complicated alternative. It is human nature.


So is this the whole answer to what drives our climate? Not by a long shot! As I stated, it is part of the puzzle. Yes, CO2 emitted by man is another part. A very small, insignificant part, but a part nonetheless. I will cover several of the other pieces in the coming weeks.

June 9, 2009

Breath or Sun ?


FROM-WKYC
Global warming, man-made? Not so much...

HEADLINE NASA: Solar activity, not man, responsible for past global warming


Some researchers believe that the solar cycle influences global climate changes. They attribute recent warming trends to cyclic variation. Skeptics, though, argue that there's little hard evidence of a solar hand in recent climate changes.

Now, a new research report from a surprising source may help to lay this skepticism to rest. A study from NASA's Goddard Space Flight Center in Greenbelt, Maryland looking at climate data over the past century has concluded that solar variation has made a significant impact on the Earth's climate. The report concludes that evidence for climate changes based on solar radiation can be traced back as far as the Industrial Revolution.

Past research has shown that the sun goes through eleven year cycles. At the cycle's peak, solar activity occurring near sunspots is particularly intense, basking the Earth in solar heat. According to Robert Cahalan, a climatologist at the Goddard Space Flight Center, "Right now, we are in between major ice ages, in a period that has been called the Holocene."

Thomas Woods, solar scientist at the University of Colorado in Boulder concludes, "The fluctuations in the solar cycle impacts Earth's global temperature by about 0.1 degree Celsius, slightly hotter during solar maximum and cooler during solar minimum. The sun is currently at its minimum, and the next solar maximum is expected in 2012."

According to the study, during periods of solar quiet, 1,361 watts per square meter of solar energy reaches Earth's outermost atmosphere. Periods of more intense activity brought 1.4 watts per square meter (0.1 percent) more energy.

While the NASA study acknowledged the sun's influence on warming and cooling patterns, it then went badly off the tracks. Ignoring its own evidence, it returned to an argument that man had replaced the sun as the cause current warming patterns. Like many studies, this conclusion was based less on hard data and more on questionable correlations and inaccurate modeling techniques.

The incontrovertible fact, here is that even NASA's own study acknowledges that solar variation has caused climate change in the past. And even the study's members, mostly ardent supports of AGW theory, acknowledge that the sun may play a significant role in future climate changes

More...


May 4, 2009

Some have been dimmed down


FROM-Jennifer Marohasy

Quiet Sun Shouldn’t Baffle Astronomers

THE Sun is the dimmest it has been for nearly a century. There are no sunspots, very few solar flares - and our nearest star is the quietest it has been for a very long time.

That’s according to a BBC report by Pallab Ghosh, which goes on to explain these observations are baffling astronomers … the Sun normally undergoes an 11-year cycle of activity. At its peak, it has a tumultuous boiling atmosphere that spits out flares and planet-sized chunks of super-hot gas. This is followed by a calmer period… Last year, it was expected that it would have been hotting up after a quiet spell. But instead it hit a 50-year low in solar wind pressure, a 55-year low in radio emissions, and a 100-year low in sunspot activity.


According to Oliver K. Manuel, Professor of Nuclear Chemistry at the University of Missouri-Rolla, writing to Benny Peiser from Liverpool University who compiles the e-newsletter CCNet:

“Astronomers - especially those associated with NASA - are baffled because they chose to ignore cycles of solar activity and all other observations and space-age measurements over the past five decades that were unexplained by the Standard Solar Model (SSM) of a Hydrogen-filled Sun.

“Angular momentum changes in the Sun cause deep-seated magnetic fields from the dense, energetic solar core to penetrate the visible solar surface (the photosphere) and produce cycles of sunspots and solar eruptions.

“Earth’s climate is closely linked to this cycle of angular momentum changes and to the number of sunspots at the solar surface.More...

Read entire article here

"Preemptive Denial"


Among the many things I find interesting about this article, other than the source, is that they refer to an article titled "Don't Blame Sun for Global Warming, Study Says." In the midst of an article blaming the Sun for global cooling. The intellectual dishonesty it takes to write this article without examining the obvious contradiction is both telling and typical. Another is the quote below, I am sure they have programed that uncertainty into the models. And of course you gotta love the term preemtive denial considering both the source and the context.


"There are many uncertainties. We don't know the sensitivity of the climate to changes in solar intensity. In my opinion, I wouldn't play with things I don't know."

FROM-National Geographic (amazing)

Sun Oddly Quiet -- Hints at Next "Little Ice Age"?


prolonged lull in solar activity has astrophysicists glued to their telescopes waiting to see what the sun will do next—and how Earth's climate might respond.

The sun is the least active it's been in decades and the dimmest in a hundred years. The lull is causing some scientists to recall the Little Ice Age, an unusual cold spell in Europe and North America, which lasted from about 1300 to 1850.

He and other researchers are therefore engaged in what they call "preemptive denial" of a solar minimum leading to global cooling.

Even if the current solar lull is the beginning of a prolonged quiet, the scientists say, the star's effects on climate will pale in contrast with the influence of human-made greenhouse gases such as carbon dioxide (CO2).

"I think you have to bear in mind that the CO2 is a good 50 to 60 percent higher than normal, whereas the decline in solar output is a few hundredths of one percent down," Lockwood said. "I think that helps keep it in perspective."

(Related: "Don't Blame Sun for Global Warming, Study Says.") More.......

Local Cooling

For hundreds of years scientists have used the number of observable sunspots to trace the sun's roughly 11-year cycles of activity.

Sunspots, which can be visible without a telescope, are dark regions that indicate intense magnetic activity on the sun's surface. Such solar storms send bursts of charged particles hurtling toward Earth that can spark auroras, disrupt satellites, and even knock out electrical grids.

In the current cycle, 2008 was supposed to have been the low point, and this year the sunspot numbers should have begun to climb.

But of the first 90 days of 2009, 78 have been sunspot free. Researchers also say the sun is the dimmest it's been in a hundred years.

The Maunder Minimum corresponded to a profound lull in sunspots—astronomers at the time recorded just 50 in a 30-year period.

If the sun again sinks into a similar depression, at least one preliminary model has suggested that cool spots could crop up in regions of Europe, the United States, and Siberia.

During the previous event, though, many parts of the world were not affected at all, said Jeffrey Hall, an astronomer and associate director at Lowell Observatory in Flagstaff, Arizona.

"Even a grand minimum like that was not having a global effect," he said.

Wild Cards and Uncertainties

Changes in the sun's activity can affect Earth in other ways, too.

For example, ultraviolet (UV) light from the sun is not bottoming out the same way it did during the past few visual minima.

"The visible light doesn't vary that much, but UV varies 20 percent, [and] x-rays can vary by a factor of ten," Hall said. "What we don't understand so well is the impact of that differing spectral irradiance."

Solar UV light, for example, affects mostly the upper layers of Earth's atmosphere, where the effects are not as noticeable to humans. But some researchers suspect those effects could trickle down into the lower layers, where weather happens.

In general, recent research has been building a case that the sun has a slightly bigger influence on Earth's climate than most theories have predicted.

Atmospheric wild cards, such as UV radiation, could be part of the explanation, said the University of Southampton's Lockwood.

In the meantime, he and other experts caution against relying on future solar lulls to help mitigate global warming.

"There are many uncertainties," said Jose Abreu, a doctoral candidate at the Swiss government's research institute Eawag.

"We don't know the sensitivity of the climate to changes in solar intensity. In my opinion, I wouldn't play with things I don't know."


April 15, 2009

"Watch your back Willie"


via Climate Fraud

from American Thinker

Breaking News: 'Sunspots May Cause Climate Fluctuations'


Are sanity and science about to make a comeback in climatology? Willie Soon, a researcher affiliated with the Harvard-Smithsonian Center for Astrophysics and the Harvard College Observatory, offered his comments in this article at thecrimson.com

The title of the article at the The Harvard Crimson wins the award for stating the obvious: "Sunspots May Cause Climate Fluctuations, Harvard astrophysicist says recent cooler temps are a result of fewer sunspots." Apparently this researcher didn't get the memo to just go along with the CO2 theory to keep the money rolling in.

Here is a sample:

Sunspot activity may be a primary factor in climate fluctuations, according to Willie Soon, a researcher affiliated with the Harvard-Smithsonian Center for Astrophysics and the Harvard College Observatory, who offered the hypothesis in an interview with TG Daily, an online news source.

Although many climatologists have cited increases in carbon dioxide as the primary cause of the temperature increases associated with global warming, Soon maintained that solar radiation from sunspots also has a great effect.

“The sun is a great driving force to climate change,” Soon said in an interview with The Crimson yesterday, adding that most observed climate data could be explained by fluctuations in solar radiation.

Sunspots—pockets of magnetism on the sun’s surface—generate high levels of energy, which then heat the Earth’s atmosphere.

Soon told TG Daily that the lack of additional energy resulting from a decrease in sunspots is directly responsible for colder temperatures experienced in recent years.

He said that, as of last week, there had been sunspots on only 11 days this year, and there were only 99 days with visible sunspots last year—the second-lowest total since 1911.


It might be a good idea to copy this article and save it. This researcher may have a visit from a couple of guys wearing dark suits and sunglasses soon and we may never hear from him again.

April 10, 2009

Thinking needs to change


"If this deep solar minimum continues and our planet cools while CO2 levels continue to rise, thinking needs to change. This will be a very telling time and it's very, very useful in terms of science and society in my opinion".


Harvard astrophysicist: Sunspot activity correlates to global climate change

Boston (MA) - Harvard astrophysicist Dr. Willie Soon tells us that Earth has seen a reduced level of sunspot activity for the past 18 months, and is currently at the lowest levels seen in almost a century. Dr. Soon says "The sun is just slightly dimmer and has been for about the last 18 months. And that is because there are very few sunspots." He says when the sun has less sunspots, it gives off less energy, and the Earth tends to cool. He notes 2008 was a cold year for this very reason, and that 2009 may be cold for the same.


As of today, there have been 15 days in a row without any sunspots. In 2008 there were 266 days scattered throughout the year without sunspots, and in 2007 there were 163 days without sunspots. These are the #2 and #9 fewest sunspots years seen since 1911.

Dr. Soon's field of specialty is the sun. He explains that sunspots are planet-sized pockets of magnetism with much greater energy output and matter expulsion, some of which strikes the Earth's atmosphere as extra energy from the sun. He says when sunspots are present, the temperature goes up, when they are not present the temperature goes down. He also told a reporter at WBZ, CBS TV 38 (in Boston, MA) that beginning in 1645 and continuing through 1715, there were no observed sunspots. This is the period known as the Little Ice Age.

He also explains that sunspots go in cycles, which are around 11 years. There are periods of maximum activity (called the Solar Max) and periods of minimal or no activity (called the Solar Min).

Around the year 2000, the current cycle had reached its maximum. As of right now in 2009, it is at a period of zero sunspot activity. Still, he explains that no one knows for sure how long the cycles will last, and there are precedents that sunspots can persist for long periods of time, or there can be few or none for long periods of time (as happened between 1645 and 1715 during the Little Ice Age).

So far in 2009, the sun has had no sunspots for 88 out of the 99 days so far this year. Dr. Soon calls what we are seeing "the first deep solar minimum of the space age", and "In fact, this is the quietest [fewest sunspots] Sun we have had in almost a century".

In a separate video interview, he explains some possible scenarios which align with global temperature changes relating to sunspot activity, as the increased or decreased energy output from the sun affects the Earth's climate.

He explains in that interview:


"When the energy input to the Earth from the sun is lower, you can easily imagine then what the first effect would be -- heating less of the ocean's surface. This promotes less evaporation of water vapor from the ocean, reducing what we all know to be the major green house gas, water vapor, in contrast to atmospheric carbon dioxide. Then, you would say that if the sun provides less energy to warm the ocean's surface, and there is less of this water vapor and less of the water vapor greenhouse effect, then the Earth begins warming less so than you would normally have during the normal sunspot activity maximum when the sun gives off more light-energy to the planetary system.

"The second way to think about this is if the sun is giving less light to the ocean's surface, then you will also give less energy to transfer the heat, or even the material itself, from the surface to the upper atmosphere. The connection between the surface and the upper atmosphere is less than it would be, including the circulation patterns of the weather and the oceans.

"And then one can think about it another way, if you give less energy to transfer energy from the surface to higher up in the atmosphere, as high as 5 or 8 kilometers, then the chance for the system to produce these so-called thin high-cirrus clouds is less. These are the clouds that are very, very effective as a greenhouse blocker, these thin high-cirrus clouds. This is the idea that Professor Dickenson from MIT has suggested, that the Earth system may act like an iris. If it's too warm, then the iris opens, if it's too cold it closes, so that this fixture can trap heat, providing a very efficient way to warm or cool the Earth system.

"During a solar activity minimum, imagine that you produce less of these high-cirrus clouds, then the ability of the Earth to shed heat itself is a lot easier, therefore the system cools. And then continuing, when you don't have enough energy to bring all of this water vapor and the currents more than a few kilometers up, then it all accumulates at the bottom of the system, producing more of the low clouds. And on low clouds we know that they are very effective at reflecting sunlight. So again, it's another way that the Earth system can cool.

"And even another way to think about it is less energy intercepted in the tropical region, from say 20 or 30 degrees north and south latitudes, then you are able to transfer less heat energy to the polar regions, resulting in the arctic regions getting slightly cooler in that sense as well.

"So these are some of the possible scenarios that we've reached which in sort of a low-sunlight scenario would affect the Earth's weather."


Dr. Soon is an astrophysicist whose field of expertise is the sun for Harvard and the Smithsonian. He said, "The Sun is the all encompassing energy giver to life on planet Earth." And presently it's getting a lot of attention from scientists. He expects that if 2009 is another cold year which correlates to the decreased sunspot activity, that the global warming theories which attribute temperature fluctuations to increases in the levels of atmospheric CO2 will need to take notice.

He says, "If this deep solar minimum continues and our planet cools while CO2 levels continue to rise, thinking needs to change. This will be a very telling time and it's very, very useful in terms of science and society in my opinion".

Ice Skating Anyone?


via Dalton Minimum Returns

from StormX

Solar Activity Lowest in Almost 100 Years, Implications for Climate Potentially Significant


......Over the past several years, the sun has been entering another minimum in the 11-year sunspot cycle. However, the unforeseen and lingering absence of sunspots during the past year has raised concerns that another period like the Dalton Minimum could occur. The number of sunspots in 2008 was the 7th fewest since 1749, averaging only 2.9 sunspots/day. The most recent year with fewer sunspots was 95 years ago in 1913. Sunspots during the first three months of 2009 have remained exceptionally low, averaging only 1.2 sunspots/day. If this inactivity would persist throughout 2009, it would rank as the 2nd fewest since 1749, trailing only 1810 when no sunspots were observed......

April 8, 2009

Dancing Partners


From WUWT
Archibald on sea level rise and solar cycles

Anthony’s post of the Jason data reminded me that I had produced this graph:


It is derived from a post on Climate Audit of Holgate’s rate of change of sea level rise over the 20th century.

The saw tooth pattern reminded someone of the solar cycles and he overlaid it. I had the graph redrawn. The correlation is striking. The reason the Earth came out of the Little Ice Age is because we had a more active Sun, more active than at any time for the previous 8,000 years. Holgate determined that 70% of the sea level rise of the 20th century was due to thermal expansion of the oceans and the rest due to melting glaciers. Now that the Sun has become less active, that will work in reverse.

Craig Loehle’s recent paper derived that the oceans post 2003 lost one third of the heat they had gained from 1990 to 2003. Although the maximum amplitude of Solar Cycle 23 was in 2000, maximum activity was in 2003. While we are mentioning solar activity, the Oulu neutron count is still climbing.


April 1, 2009

Ignore at your peril.

You know there was a time when this would have been big news, even of great concern as regards to potential climate shift (cooler) but now it is basically ignored. Ignore the Sun at your peril.


from WUWT

NASA Headline: Deep Solar Minimum

The sunspot cycle is behaving a little like the stock market. Just when you think it has hit bottom, it goes even lower.

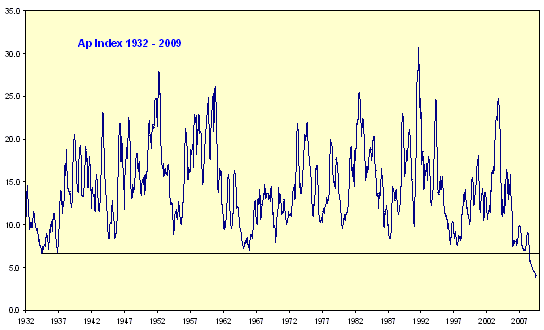
2008 was a bear. There were no sunspots observed on 266 of the year’s 366 days (73%). To find a year with more blank suns, you have to go all the way back to 1913, which had 311 spotless days: plot. Prompted by these numbers, some observers suggested that the solar cycle had hit bottom in 2008.

Maybe not. Sunspot counts for 2009 have dropped even lower. As of March 31st, there were no sunspots on 78 of the year’s 90 days (87%).

It adds up to one inescapable conclusion: “We’re experiencing a very deep solar minimum,” says solar physicist Dean Pesnell of the Goddard Space Flight Center.

“This is the quietest sun we’ve seen in almost a century,” agrees sunspot expert David Hathaway of the Marshall Space Flight Center.......