(ckick image for larger view)
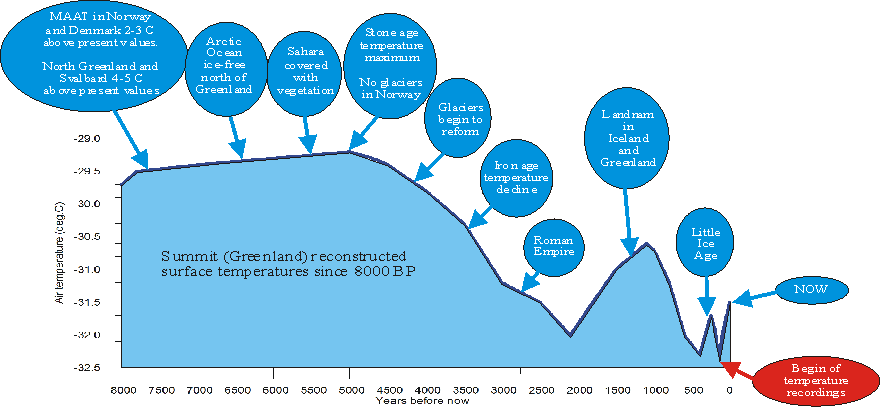
Generalised temperature diagram based on temperature measurements in the Greenland Ice Sheet (Dahl-Jensen et al. 1998), annotated with a number of historical events around the North Atlantic. MAAT is short for mean annual air temperature. Some of the text in the diagram contains links to additional information.
No comments:
Post a Comment