
This Episode brought to you by- Buy The Truth
Past behaviour can give very strong indications of just how robust systems are to perturbations and forcings. Applying this to climate, we will take a view on how believable are the UKCP09 projections of warming in the UK over the next 45 years (see the post Met Office Fraudcast). The UKCP09 projections are based on computer modelling. Below are UKCP09 ‘central estimate’ projections for changes in Summer Mean Temperatures (medium emissions scenario) for the UK.

Note that in Northern Ireland the central estimate is for a rise of 2.1 to 3.0 degrees in Mean Summer Temperature in the 2050s (and up to 4 degrees by the 2080s). Temperatures in Northern Ireland have been recorded for over 200 years, and we have a fairly good record covering the last 160 years, see below.More...
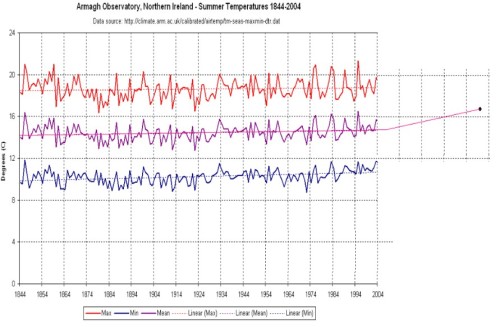
It is clear that summer temperatures in the 1840s and 1850s at the beginning of the record were more consistently warm from year to year and averaged higher maximum temperatures than those over the supposedly sizzling last 20 years – maximum summer temperatures never fell below 18 degrees from 1844-1860. The upper red trace represents the daily maximum temperatures during the day (averaged across June, July and August each year), the lower blue trace represents the minimum temperature (at night), and the central purple trace is the mean of the red and blue traces, this being the Mean Summer Temperature. The straight lines through the traces are the trend lines from the values from 1844 to 2004, 160 years. It will be seen that there is practically no trend in the maximum summer temperatures – on average, summers now are not warmer than they were 160 years ago. There is a slight trend in the minimum temperatures – the nights have been getting a little warmer over the period, and who is going to worry about that? Because of the averaging between the max and min traces, this creates a slight trend also in the Mean Temperature, but it is still an extremely minor effect over the 160 year record. Although there have been periods when the mean temperature has been a little higher (the 1840s and 1850s, for example) there have also been periods when it has been a little lower (e.g. the 1870s to 1920s). A definite period is evident when there was a noticeable short-term cooling trend (1859-1884) yet there is no significant long-term trend when considered over the full 160 years (this accords with the observations in 130-year datasets from other parts of the world as indicated in the post Crops and 130 Years of Climate Records).
Yet the Met Office and Defra are now trying to make us believe that a trend line will suddenly ‘kick up’ and take off as shown in the extended part on the right because of mankind’s carbon emissions. It certainly does look fanciful.
Why shouldn’t a cooling phase set in as it did over the 20-year period from the 1860 to 1880 when mean summer temperatures plunged at a phenomenal rate of one degree per decade? Since it happened before for completely natural (and unknown) reasons, it can happen again, and such a trend would completely cancel any projected rise claimed to be due to human emissions. It should be obvious from the temperature record above that even if there is such a thing as Anthropogenic Global Warming, its effect cannot be quantified or distinguished from any naturally occurring temperature trends and variations – in Northern Ireland, at any rate. It is the height of folly, therefore, to project a radically different and novel trend line out to the 2050s and beyond when the Northern Ireland climate has been seen to be so robust over the long term. Based on the above dataset, given that naturally occurring cooling of 1 degree per decade can and has occurred, and that there is no discernable warming trend through human agency, a scientific forecast (rather than a forecast by scientists) would take account of the fact that cooling was just as likely as warming and thus give the safest estimate for temperatures in the 2050s as the same as they are today. That is not to say that it cannot be warmer or cooler – simply that ‘no change’ is the safest scientific forecast.

As year succeeds year and no warming trend is established but cooling instead (as has been the case over recent years) the mountain to be climbed to reach the UKCP09 projections by 2050 will look ever more ridiculous. Above is a chart of global temperature anomaly since 2002 (blue) against a longer-term average. There would appear to be a cooling trend over the last 7 years (dotted blue line. The green line shows increase in CO2 concentration). Now, given the dire computer projections over the years, to have experienced stable temperatures would have been remarkable. But to have experienced such pronounced cooling when strong warming was projected is more than a little embarrassing. Temperatures in the troposphere, energy input into the oceans, increasing polar ice, and a whole battery of other indicators tell the same story. It is blindingly obvious that, after a couple of decades of warming in the 1980s and 1990s, global temperatures are simply returning back to their long-term average (i.e. to temperature anomaly = 0 degrees), just as they did after the decades of warming in the 1920s-1940s (the 1930s were the hottest decade in most of the habitable parts of the world since records began). In the 1960s and 1970s a rapid global cooling trend back to the long-term average gave rise to fanciful predictions of an impending ice age. Global cooling was the big scare then.
How many years of cooling do we need to have before the global warming alarmists will admit that they have been perpetrating an atrocious lie?
No comments:
Post a Comment