Or Riding the Titanic
(also from 1997)
Pollsters and pundits will tell you that the most important criteria in evaluating a candidate, policy, issue etc is not so much the poll numbers themselves but the intensity level behind the polls. This is why as you get closer to an election pollsters, if they do not already, switch from general public polling to "likely" voter polling. The voters after all are the ones who actually determine the election, regardless of the popularity contest amongst the public.
The same holds true in regards to issues and policies, the reason that Obamacare is in so much political trouble is that more people strongly oppose it than strongly support it, The intensity level is with those who want to repeal it. The intensity for or against something or someone is what generally determines the outcome.
Much is being made of today's Gallup poll which shows global warming at the bottom of the list of environmental issues with the American public.
Although this is important, it is nothing new, global warming has been at or near the bottom of that polling question since it has been asked.In fact in today's write up of the poll they compare it to a similar poll taken in 2001
As you can see global warming was at the bottom back then too, it usually is. Although concern has dropped considerably since 2001, concern for all of the environmental issues has dropped compared to 2001, In my opinion the drop in concern over the loss of tropical rain forests is actually more troubling than any benefit in the drop in concern over global warming. But that is for another day.
The true metric of how far global warming has fallen as an issue is the "intensity" of how people look at it as a problem. In the methodology link to the poll they have a chart which shows what percentage of people worry about the various issues "a great deal", their intensity. Here is a summary;
2011 Mar 3-6 (sorted by “a great deal”)
Pollution of drinking water 51 %
Contamination of soil and water by toxic waste 48 %
Pollution of rivers, lakes, and reservoirs 46 %
Maintenance of the nation’s supply of fresh water for household needs 46 %
Air pollution 36 %
Extinction of plant and animal species 34 %
The loss of tropical rain forests 34 %
Urban sprawl and loss of open spaces 27 %
Global warming 25 %
As you can see not only is global warming at the bottom of the list overall, it is at the bottom of the list as far as the intensity of peoples concern about it. So how do we judge this most recent poll compared to the past intensity of concern about global warming.
Last year Gallup posted a graph reflecting the "great deal" of concern figures on the issues;
As you can see in 2010 it had dropped to 28% from the 33% it had held in 2009. So in two years global warming has fallen from being of great concern for one third the public to being of great concern for only one quarter of the public.
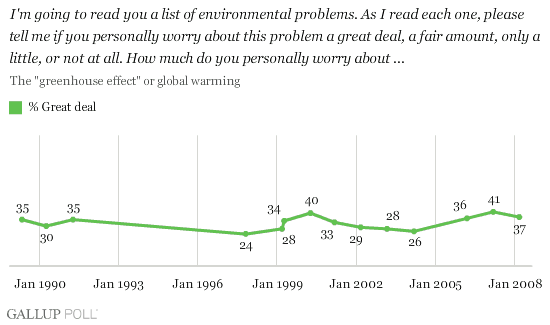
How does this compare historically? Well for some reason Gallup is making us do a bit of digging to compare apples to apples but we have done so. Perhaps in the future they will simply post the graph below updated to reflect their polls since 2008, but I can not find it on their web site. Here is the historical record of Gallup's polling on the intensity level regarding global warming through 2008:
As you can see since its high in 2007 of 41% can you say An Inconvenient Truth, Gallup did, the public's intensity about global warming has dropped from 41% to 37% to 33% to 28% and is now at 25% just slightly above the historical 1997 low of 24% which occurred just prior to the pre super El Nino year of 1998.
As you can see not only are the global warming alarmist losing the war on science, they are losing the only real thing they had going for them, they are losing the ability to scare the public.


Good column. But it's losing, not loosing....:)
ReplyDelete