
Imagine you are in an airplane flying over a mountain range. You look out your window and see a lone figure slightly below the mountain's peak looking towards the top. "Ah" you think "the man is headed towards the summit." However as you continue to observe, you notice that there are tracks in the snow leading down from the peak.
Your entire frame of reference is changed and your first assumption was wrong. The mountain climber is not ascending he is descending and is looking back at where he has been rather than where he is going. Just because someone or something is near the peak does not necessarily mean that the only way to go is up, it could also mean it is on its way down.
On October 19, 2007 the Dow Jones Average was at 13522 slightly below its historic height of 14093 set on October 12th. In the next couple of weeks it went a bit higher than on the nineteenth, but the general trend was down and of course we know that despite ups and downs, a year later the Dow would drop nearly 5000 points from its historic high of October 12 2007. For the most part back in October 2007 investors and experts were giddy at the dazzling heights of the stock markets and despite the warnings of some skeptics, most felt there was nowhere to go but up. They were convinced that the peak had not yet been reached.
Much is being written and opined about the year 2008 and the probable final global temperature when it is calculated. Depending on whom you believe it will be between the ninth and fifteenth warmest year on record. This sounds impressive and it is an obvious attempt to make it sound frightening, but which way are they looking at the peak? The fact is that they are looking back up the mountain to where we have been from where we are now.The fact is we are looking a full decade into the past to find the peak.
Much can be made of Global Warming and they do, but reality is that no matter who you believe if you believe anyone at all and there are justifiable reasons not to, the warmest year on record was 1998 it has been down hill ever since. Despite some ups and downs, based on the truth of observations we have reached our peak and begun a descent, the tracks lead down the mountain and no amount of spin can change that reality.
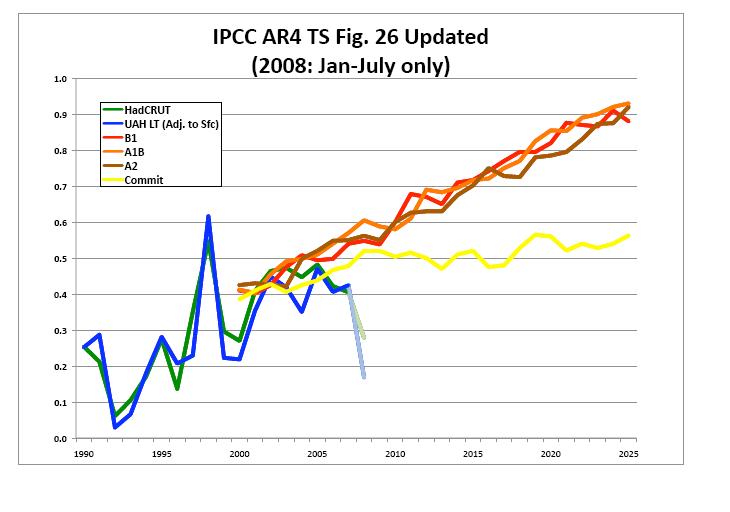
This Graph was done by Dr. John Christy. Dr. John R. Christy is the Distinguished Professor of Atmospheric Science and Director of the Earth System Science Center at the University of Alabama in Huntsville where he began studying global climate issues in 1987. Since November 2000 he has been Alabama's State Climatologist. In 1989 Dr. Roy W. Spencer (then a NASA/Marshall scientist and now a Principle Research Scientist at UAH) and Christy developed a global temperature data set from microwave data observed from satellites beginning in 1979. For this achievement, the Spencer-Christy team was awarded NASA's Medal for Exceptional Scientific Achievement in 1991. In 1996, they were selected to receive a Special Award by the American Meteorological Society "for developing a global, precise record of earth's temperature from operational polar-orbiting satellites, fundamentally advancing our ability to monitor climate." In January 2002 Christy was inducted as a Fellow of the American Meteorological Society.
Both Dr. Christy and Dr. Spencer are notorious skeptics.
The Chart (above) is simply this chart (below) which comes directly from The IPCC AR 4 report with the actual UAH (satellite) and HadCrut (land-ocean) temps over laid. The fuzzy areas in the original below are error margins for each scenario. The bottom most line (yellow above) is what was projected to happen if we maintained CO2 concentrations at their level of 2000, obviously they have risen since then.

Figure 1. Projected increases in 21st century global average temperature assuming different CO2 emissions futures (described below). These projections are from the 4AR Special Report on Emissions Scenarios (SRES), and appear in Figure SPM-5 of the Working Group I “Summary for Policymakers”.11 The zero level was set to the average temperature between 1980–1999, which is why most of the 20th century shows negative values.
Obviously temperatures have not followed the program.
No comments:
Post a Comment