05/19/2008
It is difficult to have a long-term outlook on anything; most of us look at life through the prism of our lifetime, which is only natural. Even those that have a grasp of history tend to look at events in relationship to their times and must make a concentrated effort to try to evaluate the past by understanding the times, the attitudes or even the technology that existed prior to their time here on this beautiful blue orb. Even in a single lifetime events and technologies can change the world so drastically that a person will leave a far different world than the one he first came into.
A small example would be my mother who was born in the height of the Great Depression before the television. Now she can watch HDTV via satellite, which, there were none of when I was born though my son was born to late to experience a moon landing and my daughter was born after the first Space Shuttle took flight and my grandchildren will never have known life without a DVD player. To put that in some kind of perspective, think of everything you can conjure in your mind about a small little girl in the 1930’s Depression era... got it? Now imagine this girl plugging in a DVD and watching Apollo 13 with Tom Hanks on a 52” HDTV with surround sound, it doesn’t compute does it? Oh yeah computers, oh well you get the idea.
When we talk about weather and climate today we are talking about it with the benefit of tools and technologies to observe phenomena that just a few short years ago were only observed with the human eye and analyzed with not much more than the human mind. On the WU we study nearly real time satellite images of tropical waves off the coast of Africa from the comfort of our dens and living rooms, but less than 50 years ago the only knowledge of that wave might be a note of a squall in some ship captain’s log. In the 20th century and for sure in the 19th it is possible indeed likely that monster F-4 tornadoes formed in the great empty expanses of the Great Plains and South West then died off without ever being seen by a human or at least reported, and to whom would some remote rancher in Texas report it, if he were so inclined?
Of course today any tornado, hurricane or any other weather event is not going to be missed by the modern eyes of satellites and the probing of Doppler radar. This does not take into account the population increase which make weather events far less likely to escape unnoticed and be broadcast 24/7 on cable news.
I was born in 1955, not so long ago unless you are five. In 1955 the U.S. Population was 165,931,202 it is currently 304,077,089 the world population was 2.8 billion currently it is 6.6 billion. So there are a whole bunch more people, actually more than twice as many in the world than just over 50 years ago. Obviously with more people there is a greater chance that people will be affected by weather events, it does not necessarily mean the weather events have changed drastically only that our ability to observe them and that they will affect humans has increased dramatically. Add to that the fact that a major typhoon slamming into China in the 30’s might eventually be mentioned on a radio news broadcast. Whereas today it is breaking news on CNN, in living color, an event we have been watching unfold on the Weather Channel or our computers as it made its way across the Pacific for two weeks.
Compared to just a few decades ago we watch our globe, its weather and its climate indicators through a microscope. I often joke that the reason I don’t go to the doctor is that if I did he would find something wrong. Obviously not a wise philosophy for personal health but it brings up a point. The more we are able to dissect the workings of our world, the more likely we are going to find things that were unobservable and unknown not that long ago. A simple example is the claims last year that Arctic sea ice was at its lowest levels in recorded history, this of course is true, it is also true that recorded history in this case only goes back to 1979 when they began measuring it with satellites. Now for my 7-year-old granddaughter who fears for the Polar Bears, this is an ancient historical record, for me it is a reminder of my first marriage and for my mother, well, to her, it is just like yesterday.
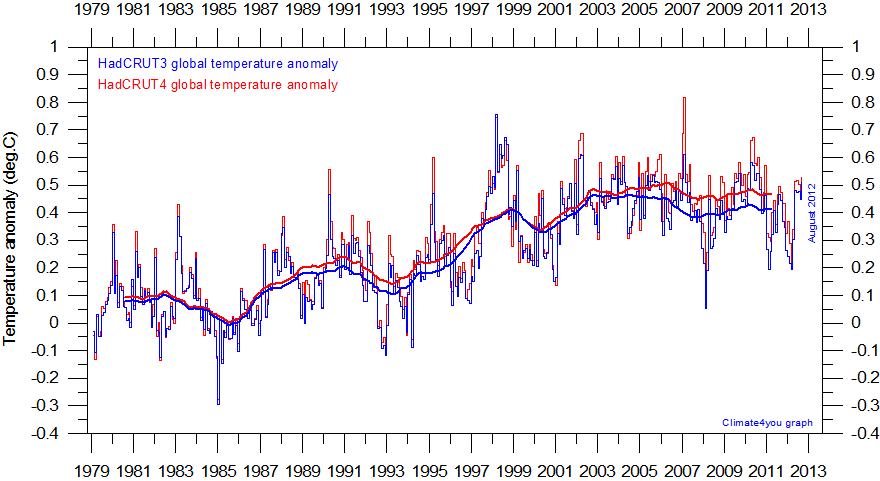
Speaking of 1979, here are the annual global mean temperatures from then until now:
1979 - 57.283
1980 - 57.328
1981 - 57.398
1982 - 57.229
1983 - 57.508
1984 - 57.166
1985 - 57.133
1986 - 57.261
1987 - 57.520
1988 - 57.513
1989 - 57.396
1990 - 57.645
1991 - 57.565
1992 - 57.326
1993 - 57.387
1994 - 57.504
1995 - 57.686
1996 - 57.448
1997 - 57.825
1998 - 58.147
1999 - 57.744
2000 - 57.699
2001 - 57.931
2002 - 58.019
2003 - 58.037
2004 - 57.999
2005 - 58.055
2006 - 57.960
2007 - 57.913
This is from Had Crut the official temperature keeper for WMO and therefore the IPCC. I converted the anomaly from centigrade to Fahrenheit. they use a 1961-1990 baseline which means they averaged the temperatures in those years and compare all temperatures in their data based on that mean average, which is 14 degC or 57.2 degF. I just thought it might be important to show what we are talking about when we are talking about global warming. We are not talking about dramatic shifts in temperature, we are talking about tenths and hundredths of degrees. Below is a graph of the above temperatures.

click for larger image
Not terribly frightening is it? To put it in perspective the year 1854 the temperature was 56.662 and in 1878 it was 57.168 which you might notice was warmer than 1985.
Please note in the above chart and data that according to the official record, no year since has been warmer than 1998. Does this mean that global warming has stopped? Nobody knows, but when you look at time and the world through a microscope and see this

You certainly would think the world was coming to an end.
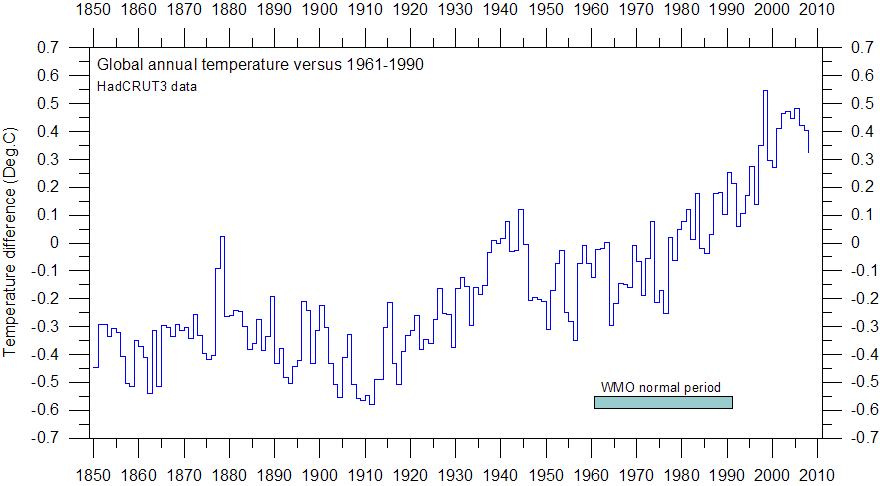
You must remember to look at the numbers; they are not nearly as scary as the graph. The official increase in temperatures for the century ending in 2005 is .76 degC or 1.37 degF. Has the earth been warming? Obviously

click here for larger image
The temperature in 1850, first year of above graph was 56.410 and the temperature for 2007 was 57.193 a difference 0f 1.5 degF.
How much is natural and how much is caused by man, nobody knows, but when you look at the world and time through a microscope, you miss the big picture.

Oops :)
f'=f (vv0加減vvs減加)factor接近取上方符號遠離取下方符號
ReplyDelete悉怛多缽怛囉阿門